
All sales leaders measure performance to some extent.
But the successful ones? They come armed with the latest tech, from AI to predictive analytics. This means all their strategic and managerial decisions are solidly backed up by powerful data.
In the past, measuring sales performance involved a ton of guesswork — while data collection and analysis was a total time sink. And as sales managers spend about 90% of their time running business-as-usual sales process tasks or putting out fires — and often aren’t trained in data analysis — it typically fell by the wayside.
But in 2024, dealing with data is child’s play.
Thanks to advanced tech tools that empower sales leaders to spot trends, derive crucial insights and enhance strategies for success, it’s now much easier to be proactive.
Modern sales leaders who fail to accurately and efficiently harness data to measure and improve their strategy risk being left behind.
But where do you start?
In this guide, we’ll take you through how to track sales performance and drive your team to success in seven steps, with precise and actionable strategies.
4 Reasons Why You Need To Measure Sales Performance
There are numerous reasons why tracking sales performance can boost the bottom line.
Here are four of the most important.
1. Revenue Forecasting
Accurate, real-time revenue forecasting empowers senior leaders to make data-driven decisions around resource allocation, pace of growth, and plans.
Measuring sales performance is the most effective way to conduct revenue forecasting.
With valuable data at their fingertips, sales leaders can more accurately predict financial outcomes and regularly update senior stakeholders on sales teams’ progress toward revenue goals. It’s then much easier to manage the CEO’s lofty expectations — making end-of-year or quarterly reporting way less daunting.
And this data is not only valuable for C-suite execs.
Drill down into the data to more effectively benchmark and set realistic revenue objectives for individual sales reps — and then track their progress.
2. Evaluate Your Sales Strategy
Is your sales strategy working?
There’s a question that has kept generations of sales leaders up at night.
Tracking your team’s performance is a surefire way to find out if the implementation of your sales strategy has been effective. Are your workflows running smoothly? Are there any gaps in your sales operations? Are your sales reps on track to hit their goals?
Painful as it may be to discover that your sales pipeline is leaking qualified leads or half your team’s time is being sunk into admin, it’s better to know sooner rather than later.
3. Adapt Your Strategy
The best sales leaders take accountability when they’ve made the wrong call, and then take precise, effective action to rectify the issue.
But if your team is failing to close time and time again, or the top of the sales pipeline is looking sparse, the cause is not always obvious.
So put your detective hat on and do some digging.
From your data, you may be able to see a lack of preparation time recorded ahead of meetings and deduce this is why no one is closing.
That bottom-heavy sales pipeline? Could it be because 80% of team resources have been allocated to nurturing that one huge lead over the past couple of weeks?
Using this data, you can identify exactly what’s going wrong and swiftly adapt your strategy to correct the issue – from reallocating resources to shifting priorities.
4. Motivate Your Sales Team
By nature, sales reps love targets and numbers — and cold, hard data is an effective motivational tool.
Put transparent, easy-to-understand sales metrics data at your team’s fingertips and watch the carrot-on-a-stick effect take hold.
Whether your management strategy is one of healthy competition or productive collaboration — or a bit of both — displaying sales performance monitoring data will do a lot of the heavy lifting for you.
Delve into the data to see which team members are performing and which are consistently falling short. Change the parameters to find out how long any problems have been occurring.
Next, take a granular view to discover where in the sales cycle various team members are struggling, and if the issue is linked to specific prospects, leads, or clients.
You can then tackle the issue in a precise and effective manner.
Here’s an example:
You have a team member who is a talented prospector, but the data suggests they’ve been losing a high percentage of leads at the nurture stage since day one.
Armed with this information, you can pair them with a colleague who is skilled at nudging leads down the funnel. Provide targeted training, share specific resources, and ensure they’re fully supported while nurturing. Finally, task them with increasing their conversion rate by X% by Y date, and arrange regular meetings to track progress.
Now you know why the measurement of sales performance is crucial for success, it’s time to tackle the how.
Step 1: Establish Core Sales Metrics
The first step is to establish your core sales metrics. You will use these metrics to track progress toward your overall sales goals.
The sales metrics you select will depend on various factors including:
- Your organisation’s 2024 goals
- The size of the business you work for
- The product and/or service you sell
- The composition of your sales team
- The specific challenges of your sales team
- Any campaigns or product/service launches you’re planning for 2024
Here are some of the most important sales metrics to consider, from monthly recurring revenue to churn rate, ordered by their position in the sales funnel:
- Lead response time – The average time it takes for a sales representative to follow up with a lead after they have first self-identified as a lead
- Opportunities created – The number of sales opportunities the rep decides to chase, and a useful indicator of top-of-funnel health
- Number of deals in the pipeline – This is useful for identifying any faults within the sales pipeline, as well as getting an overview of its overall health
- Number of sales calls/outreach emails/meetings/demos scheduled – These sales productivity metrics help to measure the productivity of your sales team
- Win rate – The percentage of closed sales deals compared to the total number of sales deals
- Conversion rate – The number of leads converted into sales, divided by the number of qualified leads the team has received makes up your conversion rates
- Cost of selling – The amount you spent to sell the product
- Customer acquisition cost – How much the business expects to spend to acquire a new customer
- Length of the sales cycle – Use this metric to improve the accuracy of revenue forecasts
- Quota attainment – How a sales rep or team has performed compared to the quota set for them over a specific period
- Sales forecast accuracy – How accurate is your sales forecast? This shows how well you understand your customer base
- Average deal size – Total revenue earned divided by the number of closed deals in that period
- Number of new customers – A simple but useful metric for measuring growth and sales team performance
- Percentage of revenue from new business – Find out how much of your income is generated from new customers
- Percentage of revenue from existing customers – Find out how much of your income is generated from existing customers, often as a result of upselling or cross-selling
- Net promoter score – How likely are your customers to recommend your business?
- Customer satisfaction – How happy are customers with their experience with the organisation?
- Total revenue - The overall income your business has generated
- Year-over-year growth – Compare this year’s growth to where the business was last year
- Monthly recurring revenue (MRR) – Predictable recurring monthly income generated by existing customers every month
- Annual contract value – This considers not just deal size, but also the duration of the contract and usage of the product and/or service
- Customer retention rate – The percentage of customers who continue to pay for the business's products and/or services
- Churn rate – The percentage of customers who stopped paying for the business's products and/or services (sometimes known as attrition rate)
- Customer lifetime value – The revenue your business expects to generate from one customer throughout their relationship with the company
But don’t just select out-of-the-box metrics and get them up and running.
Instead, customise.
Consider which metrics — and which combinations of metrics — will deliver your must-have insights. Keep your business strategy, your goals, your sales process, and your team at the forefront of mind here. Whether you need to boost revenue, productivity, or client numbers – there are plenty of metrics that will empower you to put a laser-sharp focus on your priorities.
Sales leaders at brands selling subscription services, for instance, may choose ‘average contract value’ as a key metric, whereas those who sell one-off products would have opted for ‘average deal value’. Businesses offering expensive services are more likely to look at the ‘length of sales cycle’ than those with a budget product.
Track sales metrics around roles, too. It could be counterproductive, for example, to target the salesperson who deals with the highest value clients on opportunities created or a number of new customers at the same rate as their colleagues. At the same time, it would be unfair to target a sales rep who works only with SMEs on ‘average deal size’ and compare them to the high-value account salesperson.
Congratulations! After careful consideration, you’ve selected your core sales metrics.
Now, how to monitor sales performance?
First, establish your benchmarks.
Achieve this by considering your performance in previous quarters or years, as well as the performance of industry rivals. Standard industry benchmarks should also come into play here.
Then set your targets.
They should align with overall business goals, and be aspirational but realistic. And don’t forget to take the context — such as concerns from your team or shifts in the industry landscape — into consideration.
Step 2: Set Up Robust Tracking Systems
Once you’ve established your core sales metrics, it’s time to set up accurate, effective tracking systems that won’t eat up all your time.
A couple of decades ago, tracking would have meant painstakingly recording every single piece of data on a spreadsheet (or worse, in a notebook!) — a monumental time sink for sales leaders.
But thanks to the advent of sales automation, you can reap the rewards of performance tracking without all the tedium.
Seek out tools that streamline your data, allowing you to instantly see which aspects of your sales operations are working and which are not. Ultimately, you need to be able to draw practical conclusions from your data at a glance.
This is where OneUp shines. A leading sales performance management tool, it makes the process of reporting on, visualising and gamifying that all-important data are super simple.
How?
When segments of data are floating around the office on a wide variety of tools, apps, and accounts, making sense of it all is a time-consuming headache. And identifying trends or flaws in your system? Impossible.
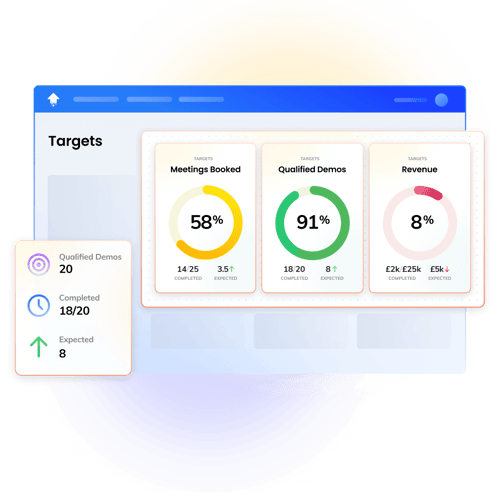
OneUp empowers sales leaders to develop a single source of truth, pulling in data from their CRM, VoIP, Sales Engagement, and Timesheets software in real-time. Want to know how to track sales closer performance, or get a quick pipeline overview? With all your performance data in one place, it’s now simple to see what’s going wrong — and what’s going right — within your operation.
Vitally, you can also set up custom dashboards tailored to your targets, and easily track your team’s progress.
Automation comes into play here too — save time on reporting with automated emails of your reports whenever you need them. Other handy AI features include triggering office-wide emails whenever a big event occurs, such as a huge deal closing, with a log of all automated communications available to ensure you never miss an update.
The best sales productivity tools go above and beyond simply helping sales leaders track and analyse data.
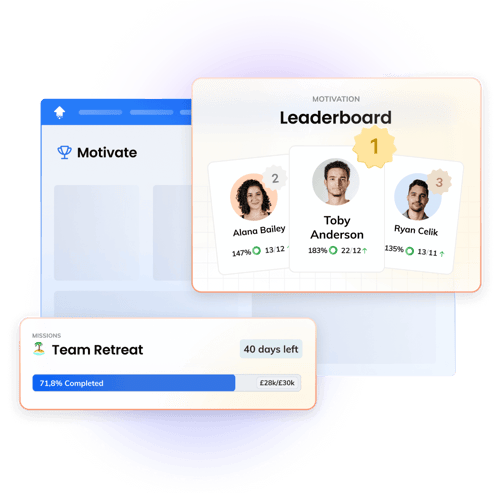
Indeed, OneUp enables the sharing of live leaderboards and targets throughout offices, fostering healthy competition between colleagues and teams. Find out how to track sales closer to performance at a high level or on a granular basis to inspire your team.
You can also use it to incentivise your teams with missions, challenges, and leagues, and celebrate success when targets are smashed.
These motivational tools help sales leaders to focus their teams on the activities that matter, in line with business priorities, and drive accountability.
It’s also worth looking out for communication capabilities within performance management tools. For example, on OneUp you can share alerts via email or chat to keep team members on track and update sales reps with a daily digest of the previous day’s activity.
Remember — before choosing a tracking system, check out its integrations to make sure it's compatible with your tech stack.
Of course, a tracking system is only going to be as robust as its data.
And sales data — entered in a busy office by team members who are commonly multitasking — is somewhat prone to human error.
Here are six tips for ensuring the reliability and consistency of your data:
- Regularly clean your data. Eliminate irrelevant, inaccurate, or incomplete data from your systems.
- Implement data entry training for every recruit who will be tasked with entering sales data, and emphasise the importance of focusing during the task.
- Carry out spot checks on each sales rep to ensure their data is accurate, complete, and up-to-date.
- Warn sales reps about what could happen if they fail to enter data accurately – for example, the entire revenue forecast could be thrown off, their targets could be set too high, or they might not get paid their commission.
- Create a data entry guide covering all tools and systems used in your office that staff members can refer back to.
- Set up CRM guardrails to eliminate human errors and keep data standardised by using mandatory fields and drop-down menus.
Step 3: Analyse Sales Data for Strategic Insights
Data analysis in sales means finding patterns, trends, and connections within the information, examining your sales process, and drawing out important strategic insights.
So exactly how you analyse your data will depend on the questions you need answers to.
But where to begin?
Comparing time frames
If you want to see what impact X action had on your sales data, you can compare two different time frames.
Example 1
You significantly increased the price of one of your subscription services at the start of Q3 as it was taking up too many resources for its monthly recurring revenue. At the end of the quarter, you find that your churn rate was up significantly since Q2, while both win rate and revenue were down. You dig deeper into the stats about this service and find sales dropped off a cliff after the price rise. Your actionable insight may be to launch a sale, discount, or re-evaluate your price point.
Comparing different market segments
Segmentation is a bit of an art — but it’s a data analysis technique that’s well worth having in your arsenal.
This is all about breaking your audience down into unique segments with shared characteristics.
You may want to segment your B2B audience in terms of:
- Company size
- Industry
- Geographic location
- Tech stack
- Job title of contact
Example 2
You segment your audience by company size when looking at the percentage of revenue from existing customers — and find SME spend has sharply decreased over the past year, while large business spend has remained the same. Subsequent qualitative research suggests this could be because SMEs have been hit with costly new compliance legislation that means they are tightening their budgets. At this point, you may decide to dedicate more sales resources to larger businesses — who do not appear to have been impacted by the legislation — for the foreseeable future.
Data segmentation can also help you to build up a profile of your ideal customer — arming you with the knowledge you need to target companies who are more likely to spend with you.
Experimentation
If you have a hunch, a hypothesis, or a question, you can test it through data analysis.
Example 3
You’ve noticed a higher level of client churn in the past three months since you instructed your team to call existing clients once per week to cross-sell or up-sell. You might hypothesise that this increased level of contact is annoying decision-makers, triggering clients to cancel your services. For the next three months, you decide to bring the number of calls down to a once-monthly check-in. You then compare your number of calls data with your churn data to see whether a higher number of phone calls correlates with churn.
Once you’ve drawn your conclusions it’s time to convert your insights into concrete, strategic actions that are simple for the sales team to implement.
Here are some examples:
Insight 1: A recent price rise is leading to higher churn and a lower win rate
Action: Instruct sales reps to alert eligible prospects, sales leads, or clients to the fact they are offering an X% discount on this service for [Y time frame].
Insight 2: Within your existing customer base, SME spend has dropped sharply while spending by large businesses has remained the same
Action 1: Move X% of resources currently dedicated to SME accounts over to large business accounts
Action 2: The sales team should spend X% of their prospecting time focussing on large businesses
Insight 3: Clients are cancelling your service as they feel harassed by once-per-week phone calls from the sales team
Action 1: Sales reps should only check in with clients once per month
Action 2: Where possible, sales reps should schedule calls with their contacts, rather than making unsolicited calls
Step 4: Data-Driven Team Performance Enhancement
So, how to evaluate sales performance?
Sales tracking shines a spotlight on performance issues across your team, from pipeline risk and at-risk deals to resourcing and customer responsiveness.
Automatic aggregation provides a clearer and more accurate overview of such performance issues, paving the way for you to coach your team to success. It answers long-standing questions such as how to measure sales manager performance or how to track sales team performance.
You can then target a sales metric such as win rate to track the impact of your team development efforts, and track progress.
Common Performance Issues Identified Through Data
Slow communication
Slow communication from sales reps to prospects, leads, or clients can be identified through data.
If a sales rep makes a lower number of calls each month than their colleagues and has a significantly longer sales cycle, this could be a sign that they are less than responsive.
Their manager needs to get to the root of this problem: is it a time management issue, are they nervous about a specific form of contact, or are their communication skills weak? Rectify the issue through coaching or training.
Failing to manage expectations
This is a common obstacle for sales reps — especially those new to the game.
A top-heavy pipeline, low win rate, low quota attainment, and low conversion rate can all signify this issue.
Dealing with a failure to manage expectations requires empathy: it can be hard to say no to a senior decision-maker when you’re a graduate sales rep who is keen to please (and close).
Pairing the sales rep in question with a more experienced agent, or coaching them through managing client expectations yourself will set them up for success.
Wasting time on prospects who are a bad fit
Every hopeful young sales rep has been there. Conversion rate is a useful metric to detect this problem.
This is where you can use your segmentation data to demonstrate the likelihood of closing deals with prospects from companies of different sizes, industries, or locations.
Set clear parameters about the type of leads sales reps should be bringing in, and don’t allow them to chase opportunities outside those boundaries — unless they have a very good business case for doing so.
Remember — the work doesn’t stop there. Use the data at your fingertips to foster a culture focused on continuous improvement and data-driven decision-making.
Step 5: Adopt Advanced Measurement Techniques
The more seasoned sales professionals among us have seen performance tracking move from handwritten notes to digital spreadsheets to CRM platforms. And now, it’s undergoing yet another evolution as AI and predictive analytics come into play.
In today’s super competitive, tech-powered market, sales reps can’t afford to have the best tools at their fingertips.
In 2024, predictive analytics are a must-have. These tools can do everything from providing more accurate data-driven sales forecasting to identifying companies likely to be your best opportunities – all from your CRM data.
And then there’s AI, which has advanced a staggering amount in the past year. As well as automating repetitive tasks, AI can be used to predict customer behaviour, and identify opportunities for upselling and cross-selling. Not only can it give managers and teams a huge amount of their time back, but it can also significantly cut costs.
Integrate predictive analytics and AI by:
- Using predictive analytics tools for sales forecasting
- Using predictive analytics tools for real-time pipeline analysis
- Getting a 360-degree view of every account, its stakeholders, and its status
- Using predictive analytics to spot trends within your data
- Using AI to track sales reps’ activity levels and alert you to unusually high or low productivity rates
- Using AI to track sales reps’ progress toward their goals
While it’s easy to get caught up in quantitative sales data, it’s essential to balance this with qualitative assessments to achieve a holistic view of performance.
Qualitative data could include:
- Customer feedback surveys
- The content of customer and sales reps’ emails
- Conversations with sales reps in 121s
- Feedback from a sales rep’s colleagues
- Social media listening
- Quotes from industry reports about the state of the market
AI can also be used to help gather some of this qualitative data, or to draw conclusions from it where it has been manually input into your system.
Step 6: Be Prepared For Common Measurement Challenges
There are a variety of common challenges sales managers face when trying to harness their data.
Thanks to recent tech advancements, taking practical steps to solve these problems quickly and efficiently has become much easier.
Challenge 1: Unclean Data
There’s little point in working with data that is inaccurate, incomplete, or inconsistent. This will paint an inaccurate picture and, in a worst-case scenario, could put you on the path to making bad business decisions.
The first step to ensure your data is clean is to implement strict rules surrounding data entry — and explain to your team why this is so important. Then, remove duplicate, irrelevant, or unwanted data points, and mend any structural errors. Identify where data is missing, and fill in the gaps.
Challenge 2: Working With Out-of-Date Information
Whether you’re reporting to the CEO, motivating your team, or sitting down for a performance review with a sales rep, working with old data puts you on the back foot.
It can lead to out-of-date projections, making decisions based on customer information that no longer applies, and a disgruntled sales team.
With tools such as OneUp, this is one challenge that’s very easy to solve. Top performance platforms deliver real-time data straight to your custom dashboards, empowering you to make decisions based on the very latest information.
Challenge 3: Accessing the Most Useful Data Sets
With so many different sales performance metrics and data sets available, it can be difficult to dig out the results you need, when you need them. Not only is this a time sink, but it can leave you floundering in meetings if an attendee asks a question about data you don’t know off the top of your head.
Tools like OneUp provide custom dashboards that are easy to create and are always just a few clicks away. These dashboards empower you to answer specific questions about performance whenever your device is near.
Challenge 4: Proving Cause and Effect
The challenge of proving cause and effect can leave even professional data scientists scratching their heads.
Imagine your team’s conversion rate has dropped. You might believe this is because three of your most experienced sales reps left the business recently.
But how can you prove it is down to this, rather than turbulent market conditions, or recent changes to your product?
AI-powered tech allows you to drill down deeper than ever into the data. This makes it easier than it’s ever been to see the activities that drive your key sales metrics — and prove cause and effect.
Challenge 5: Motivating Your Team
Once you’ve started to analyse your data, you’ll have the insights you need to make improvements.
And now you need to convince your team to get on board.
All sales leaders need strong motivational skills — but it helps to have the tech to back you up. OneUp gamifies sales, engendering healthy competition between sales reps and teams and rewarding top performers.
Think real-time leaderboards, AI-powered updates, missions, challenges, and more.
Step 7: Improve Your Sales Performance Measurement Approach
As tech advances, sales metrics evolve, and your team and business grow, it’s vital to continue to challenge and improve your approach to monitoring sales performance.
Here’s how:
1. Anticipate and Adapt to New Sales Metrics
Identify emerging sales metrics that may become crucial in future sales landscapes. Consider how these could be integrated into your measurement framework and prepare to do so.
2. Leverage Technology for Enhanced Measurement
Explore how advancements in AI, machine learning, and data analytics can be harnessed to provide deeper insights.
This is a rapidly developing and complex area. Rather than going it alone, depend on performance management tools like OneUp to ensure you stay ahead of these trends. With a simple and accessible user interface and a wide variety of integrations, OneUp does the hard work for you, putting the very latest tech advancements at your fingertips.
3. Build a Culture of Continuous Learning and Adaptation
Establish practices and workflows within your sales team to regularly review and update measurement strategies.
This will ensure they remain relevant and effective in a constantly evolving market.
4. Proactive Planning for Market Changes
Things change — and you need to be ready.
Sales leaders should future-proof their strategies by baking in plans to quickly adapt sales performance measurement in response to market shifts, economic changes, or new consumer behaviours.
5. Training and Development for Future-Ready Sales Leaders
The importance of ongoing training and development for sales leaders and managers cannot be understated.
To prepare tomorrow’s sales leaders for future challenges, focus on skills in data analysis, interpretation, and strategic planning in line with future market demands.
Closing Thoughts
Remember: sales success takes precise, proactive management.
To accurately monitor sales performance in 2024 and future-proof your team, you must start by carefully selecting your core sales metrics, in line with your business strategy and goals.
Then, use OneUp to set up robust tracking systems, complete with custom dashboards, time-saving automation, and real-time leaderboards designed to motivate your sales team. This single source of truth will empower you to analyse your data for strategic insights and make data-driven team performance enhancements.
But the journey doesn’t stop there – or ever.
With the fast-paced nature of both the sales industry and tech, you must continuously challenge and improve your sales measurement strategy to stay at the forefront of the market. This includes bringing the right tools on board to support your sales success.
OneUp is an essential tool for sales leaders. It effectively tackles common sales measurement challenges, making data accessible, and easy to interpret, and giving you back the gift of time.