
It’s been a tough year in recruitment.
As the labour market cooled and fewer vacancies came to market, we saw heightened competition among recruitment agencies.
The winners in 2023 were the agencies that trained a laser-sharp focus on productivity and performance.
Yet many continue to struggle with a lack of data transparency, leaving their recruiters without important insights into their performance.
Solid data insights and optimal performance at every stage of the recruitment pipeline, from the initial discovery of a role through to recognising the revenue from filling it, have never been more important.
In this State of Recruitment 2024 report, which is based on data from over 200 of our clients, you’ll find out how recruitment performed in 2023. This data is based on agencies specialising in permanent recruitment.
We reveal industry trends throughout the year, what the average recruitment pipeline looks like, and performance benchmarks to share with your team when setting targets.
Recruitment Trends in 2023
What did recruitment look like in 2023?
How did recruiters perform?
And how does your agency compare?
Read on to discover the biggest month-on-month recruitment pipeline trends of 2023 — and find out how you can use this data to improve your agency’s performance.
Jobs Added Trends
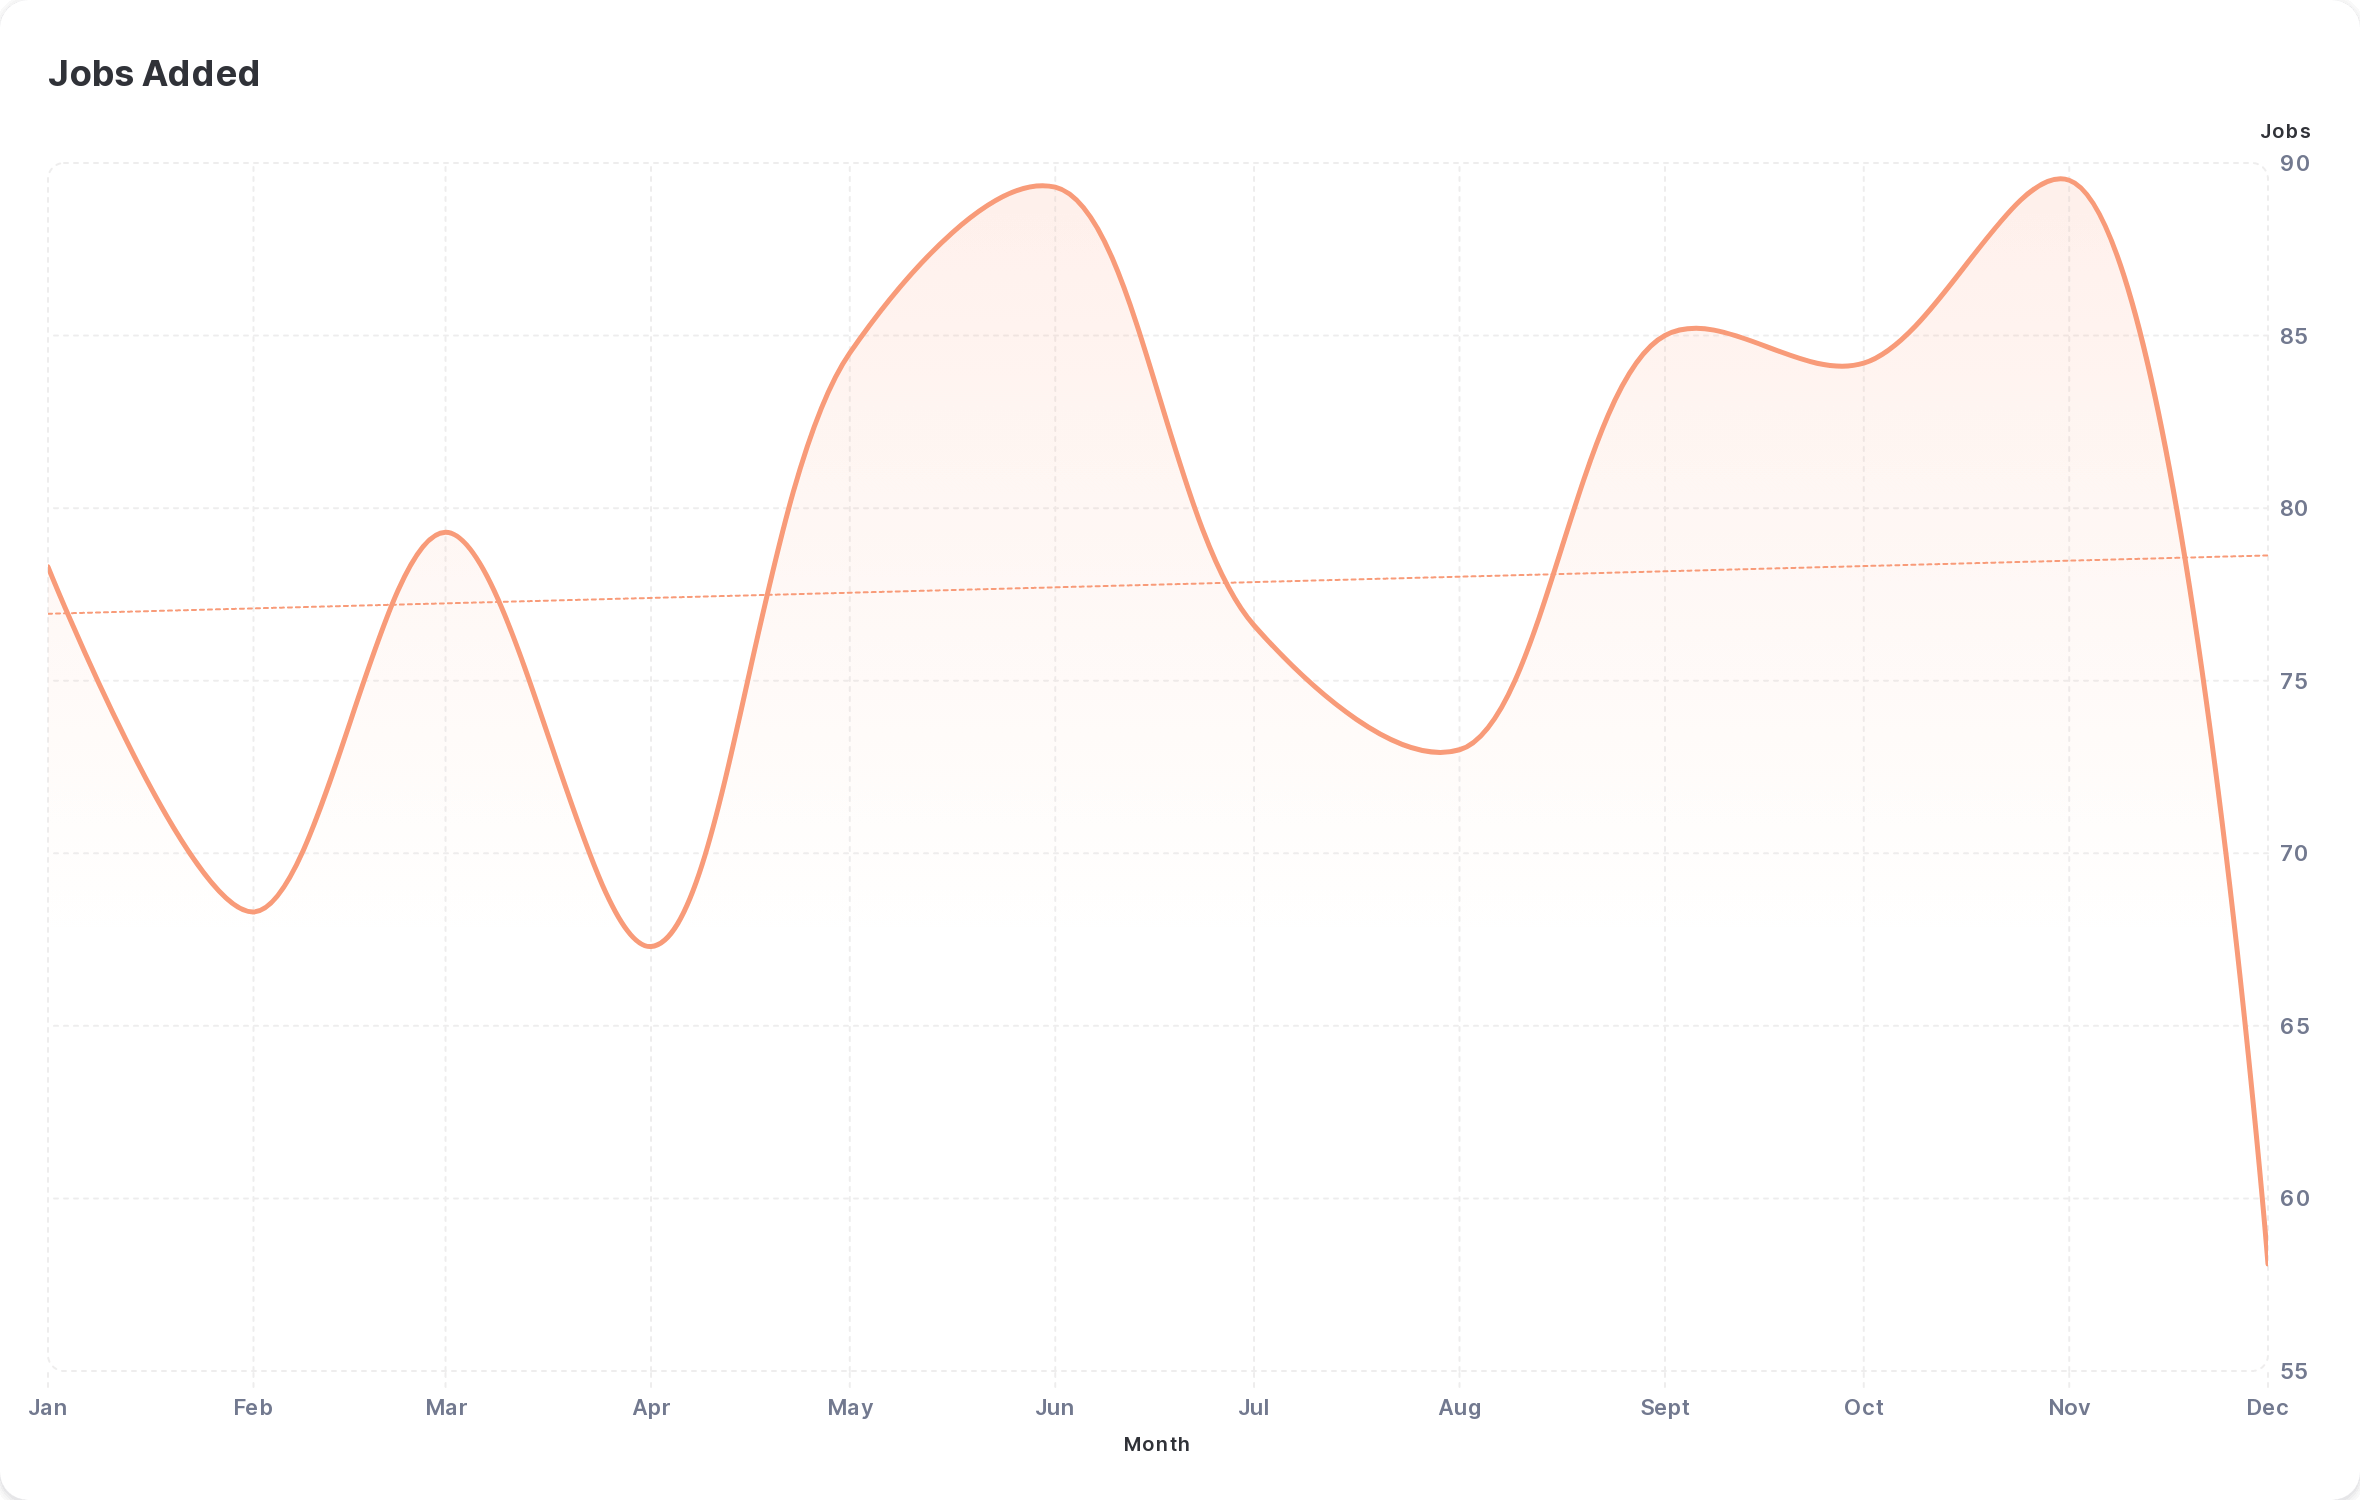
This report shows the average perm jobs sourced throughout 2023. Across the whole year, the average was 78 per agency per month.
The monthly average trended upwards throughout the year, ending strongly with November being the busiest month of 2023.
This lines up with the trends observed in previous years where companies field requirements for roles they aim to fill in the new year and also suggests an improved economic climate in the year ahead.
CVs Sent Trends
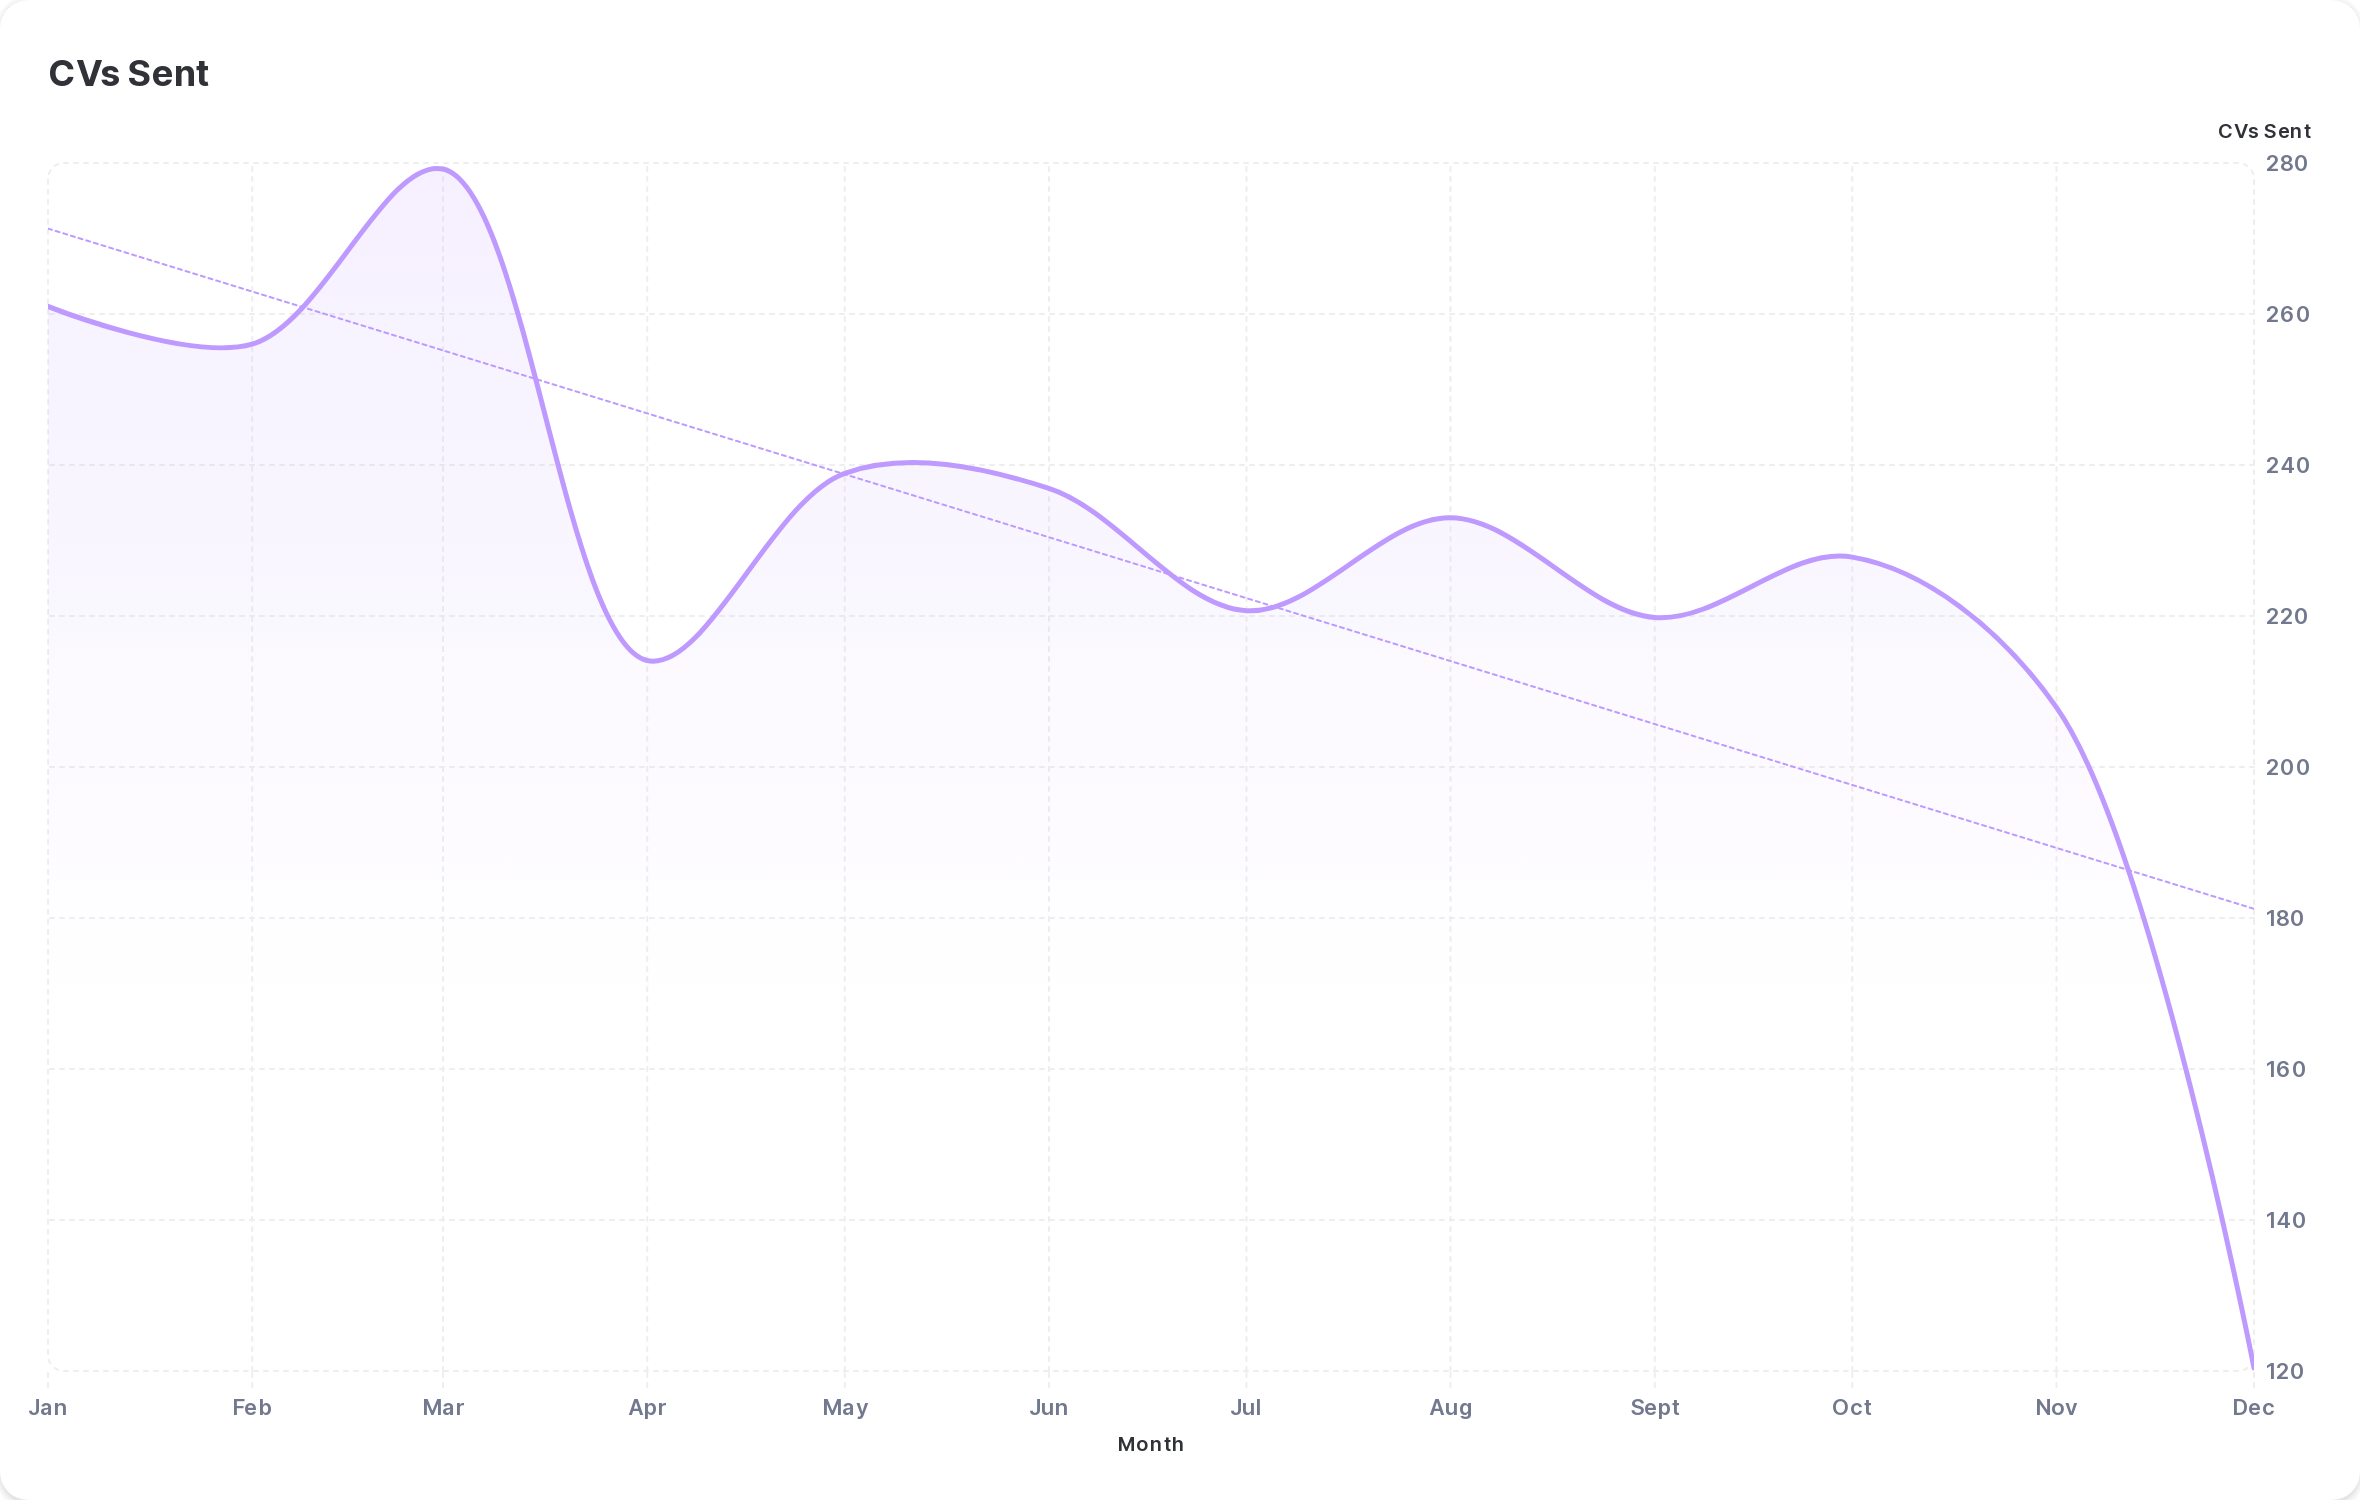
This report shows the average CVs being sent each month for perm jobs throughout 2023. Across the whole year, the average was 226 per agency per month.
The number of CVs being sent was unsurprisingly highest during Q1 2023, reflective of this being one of the busiest periods of the year for recruitment and the increased activity needed to fill the influx of jobs that came in the previous Q4.
The number declined sharply at the beginning of Q2 before rebounding and remaining relatively steady for the remainder of 2023.
1st Interviews Trends
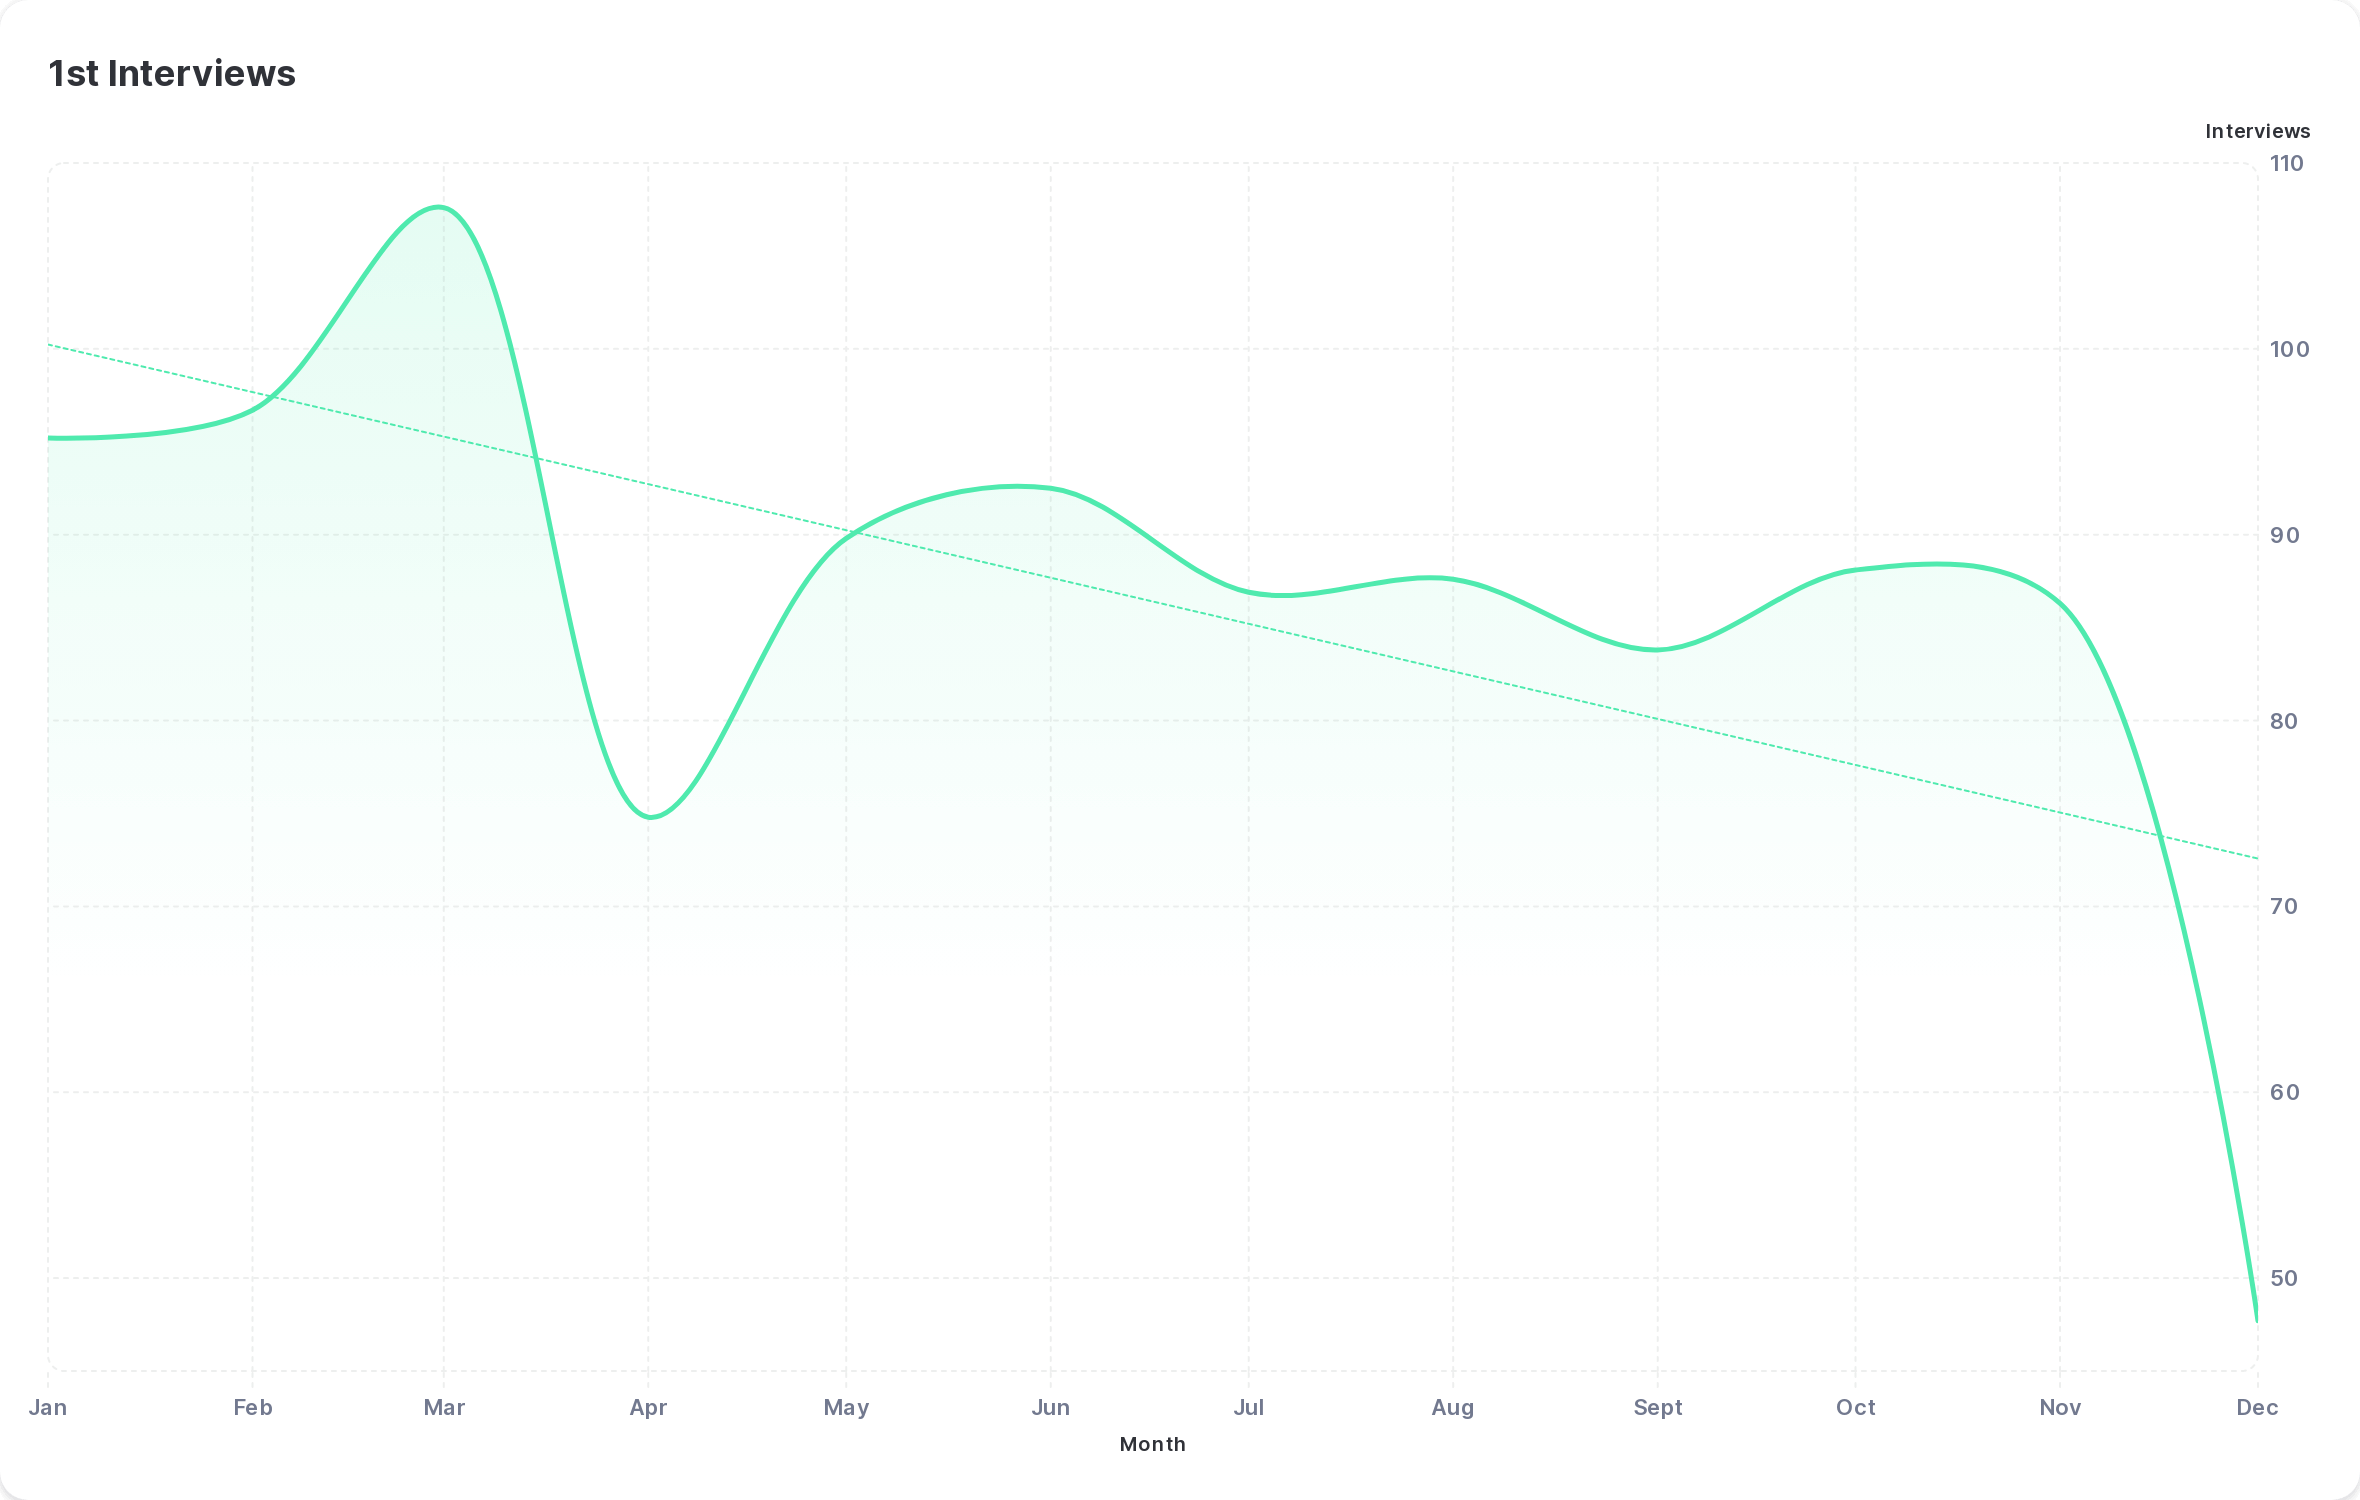
This report shows the average number of 1st interviews booked for perm jobs throughout 2023. Across the whole year, the average was 86 per agency per month.
The trends for 1st interviews booked closely mirror the trends for CVs sent. Q1 is by far and away the busiest, with a sharp drop at the beginning of Q2. This bounces back, levels off, and is fairly consistent for the remainder of the year.
"The stark contrast in 1st Interviews in March and April highlights economic uncertainty, so it’s reassuring to see the recruitment industry’s resilience in the subsequent months. This raises the question of how to accelerate the pace to 1st Interviews during tough times. Tech is the only answer."
Stuart Johnson
Head of Sales EMEA, Mercury
Placements Trends
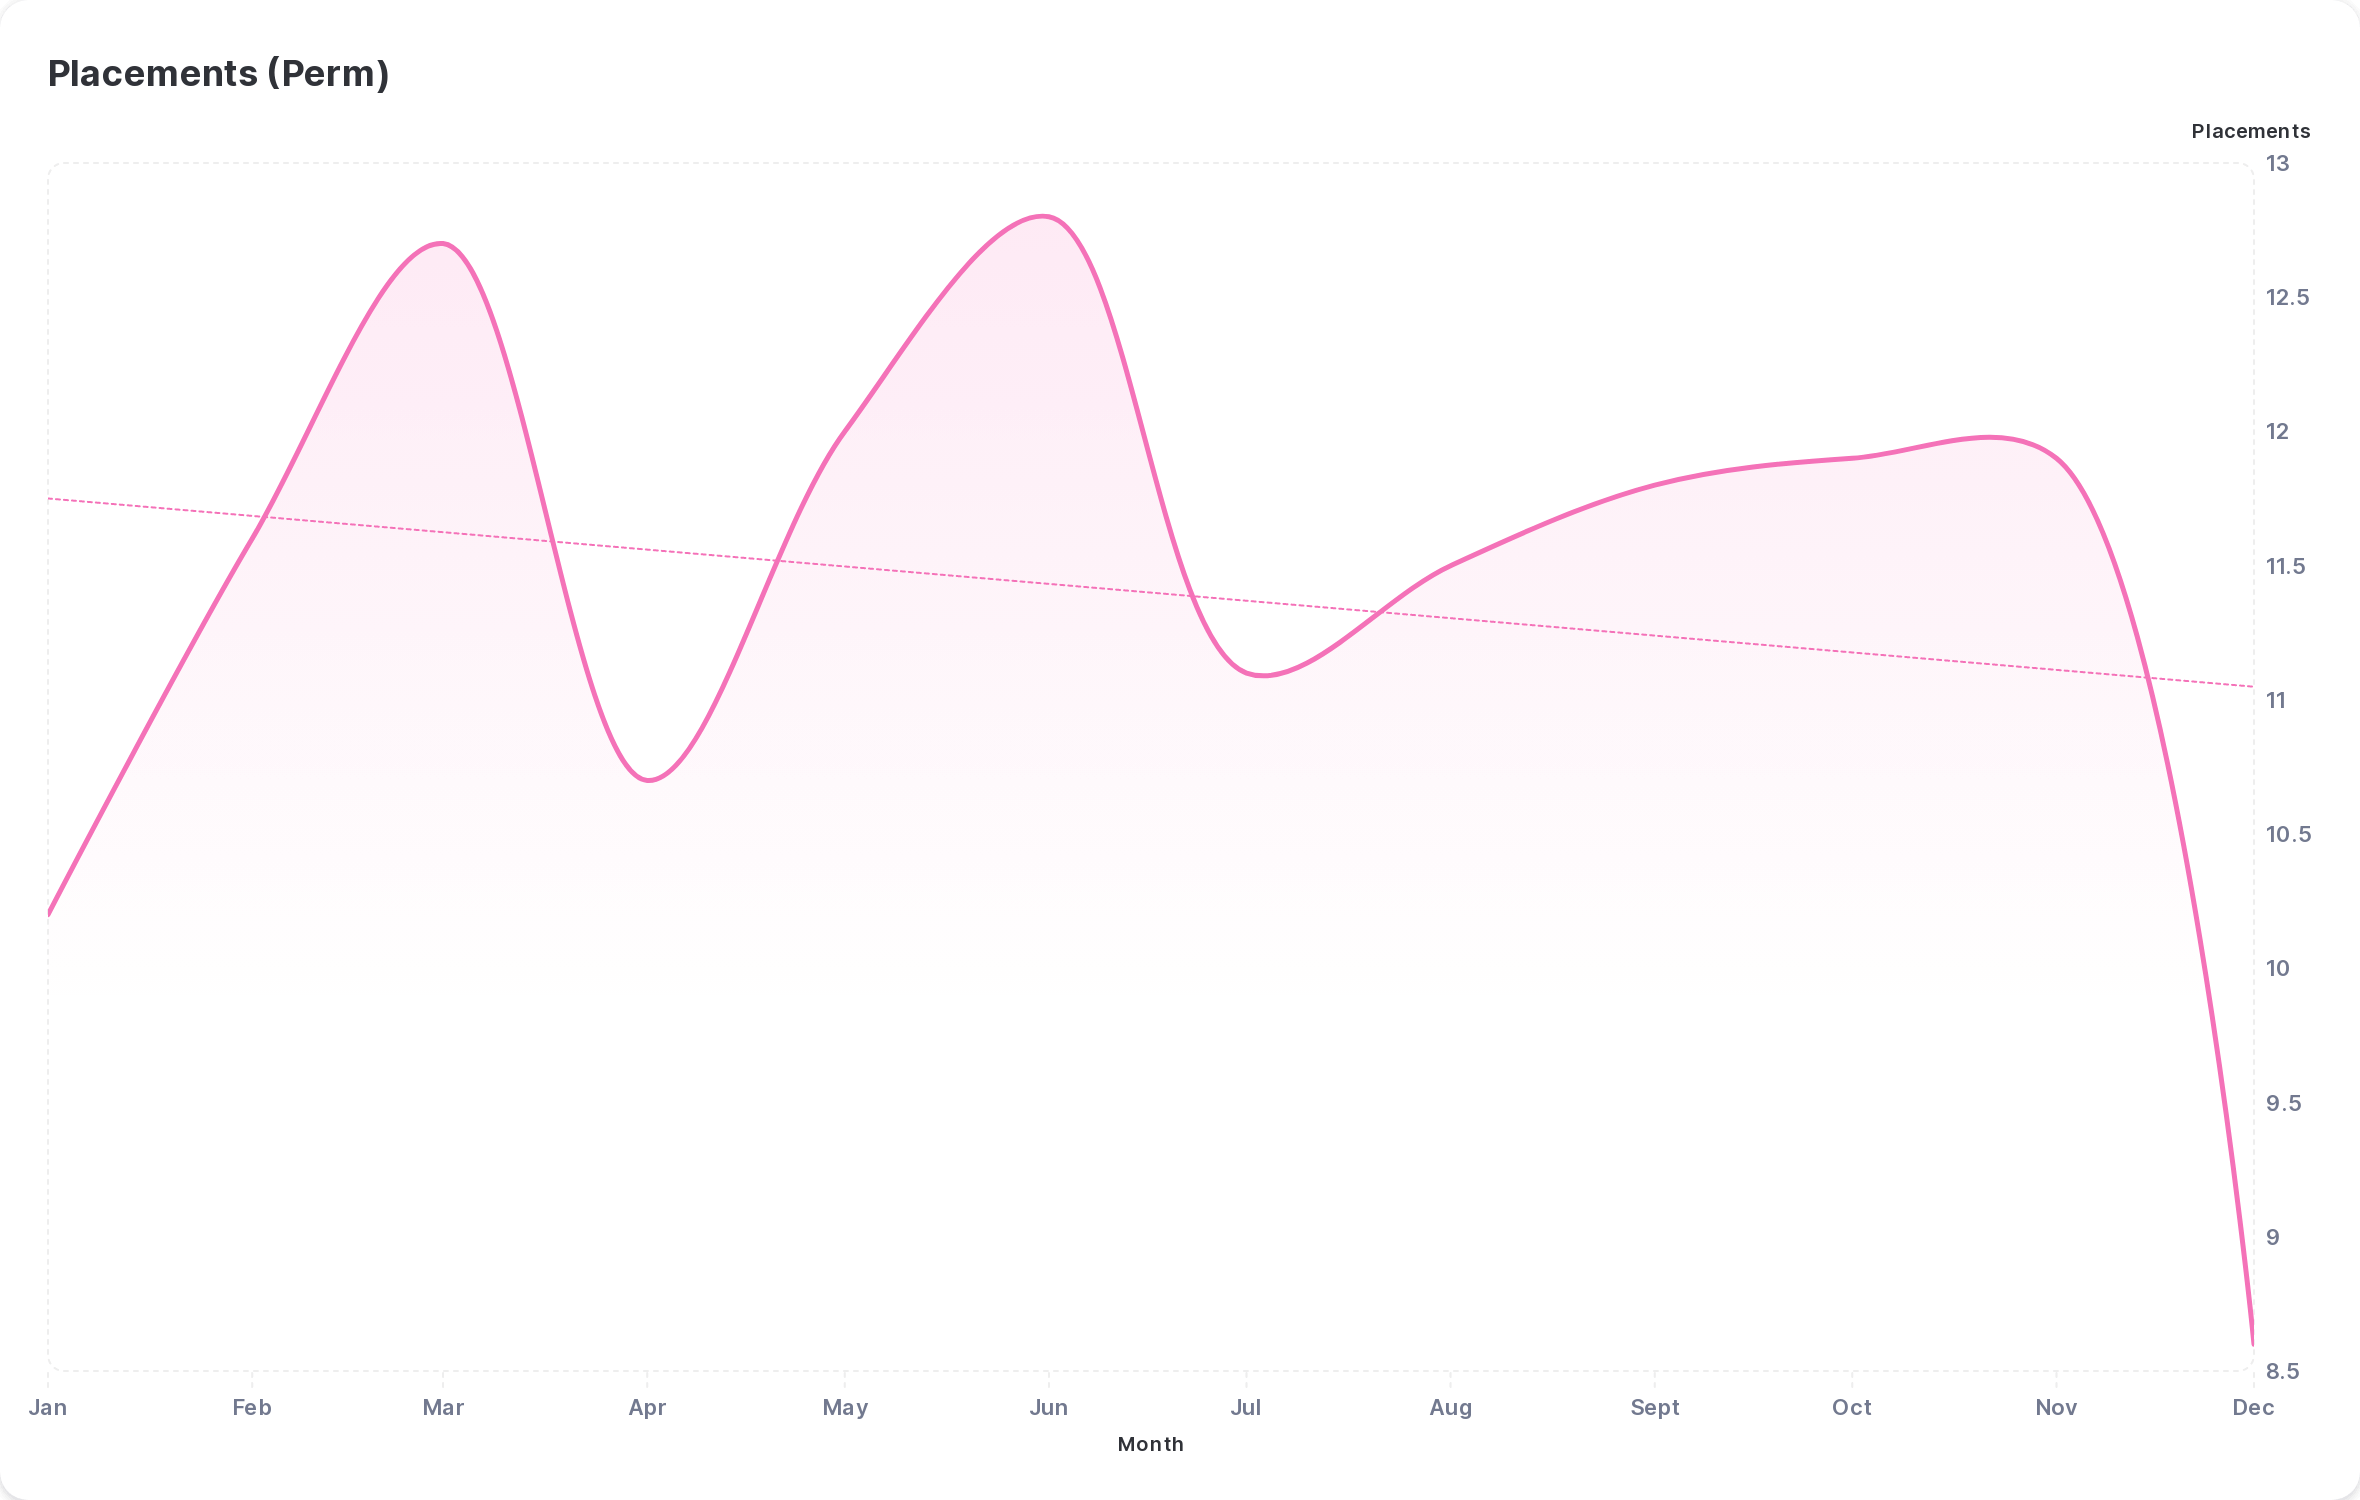
This report shows the average number of permanent placements throughout 2023. Across the whole year, the average was 11 per agency per month.
January saw the lowest placement rates of the entire year apart from December, but a March jump meant many agencies closed out Q1 strongly.
Placements remained very consistent in the second half of the year following a spike in Q2, giving a measure of predictability to agencies as 2023 progressed.
However, bearing in mind the number of jobs added gradually increased throughout the year, this shows that fill rates dropped off, indicating an increased challenge to fill placements as the year progressed.
Revenue Trends
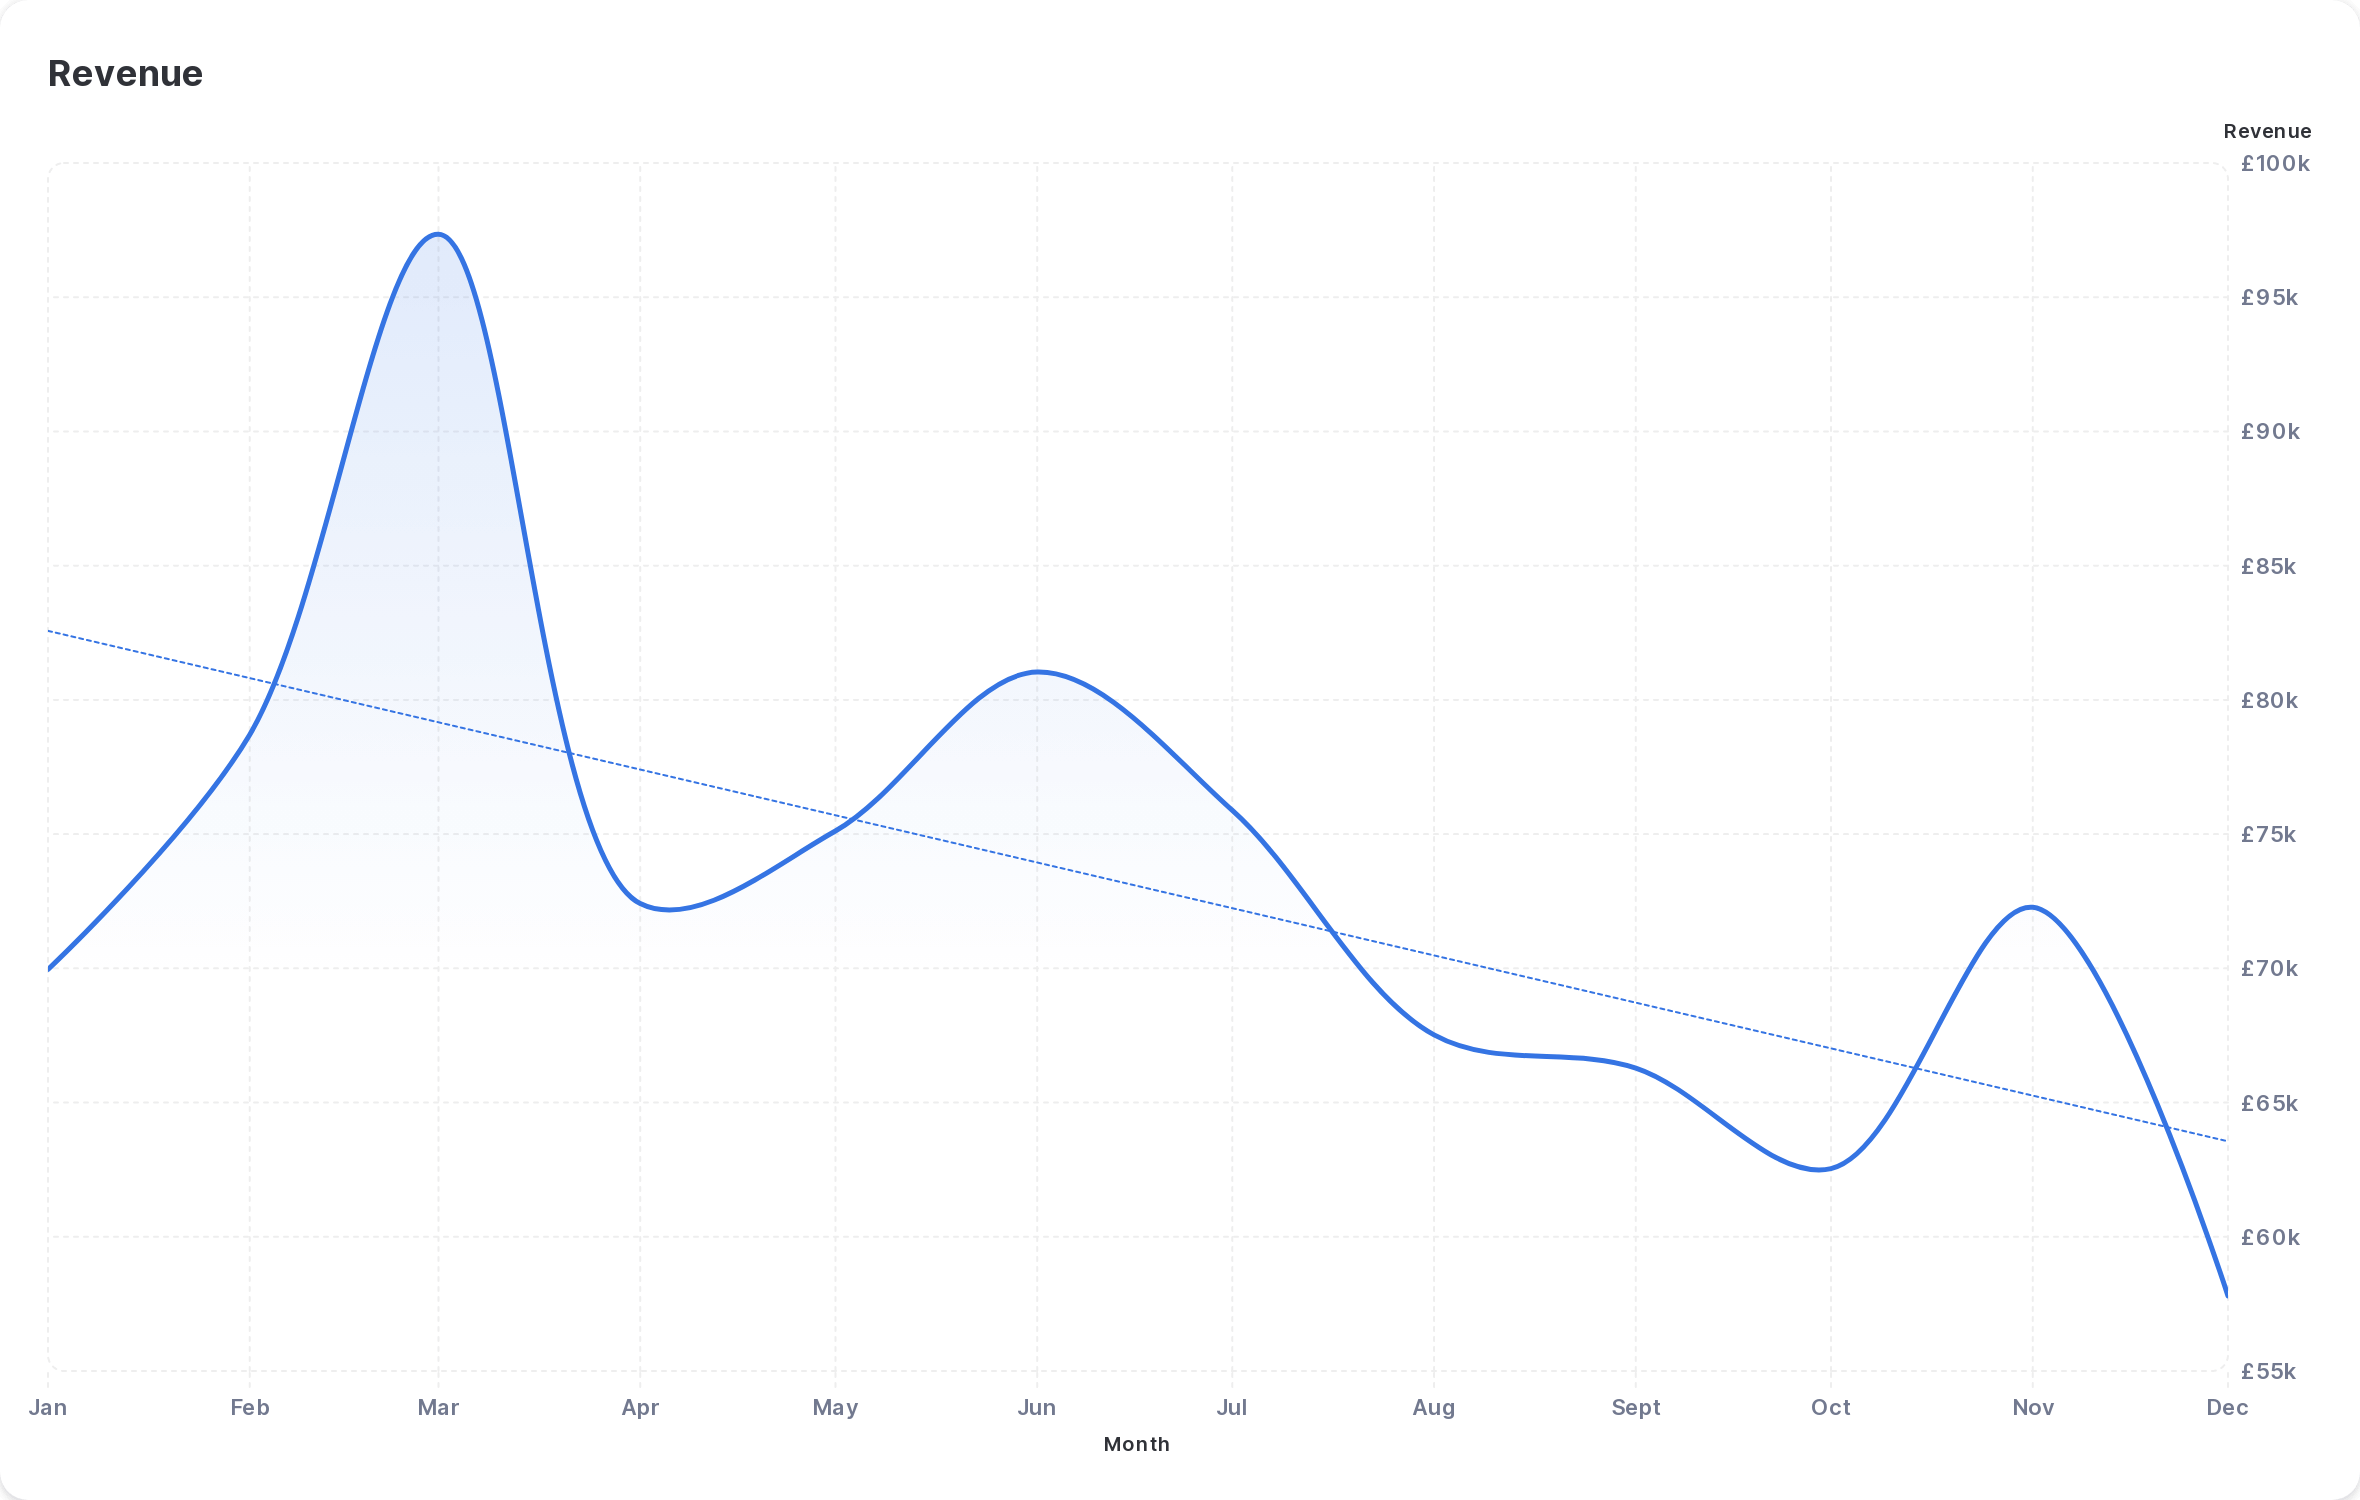
This report shows the average revenue per month for agencies specialising in perm placements throughout 2023. Across the whole year, the average was £73k per agency per month.
Most agencies finished Q1 2023 in a very strong position on the revenue front. This is a trend we saw in 2022 as well, and reflective of February and March being one of the busiest times of year in recruitment.
Revenue began to decline throughout the next several months, reflective of a tough jobs market and difficult time for recruitment agencies. However, there was a welcome bounce back in November, indicative of a better outlook and more positive sentiment as we move into 2024.
Business Development Calls Trends
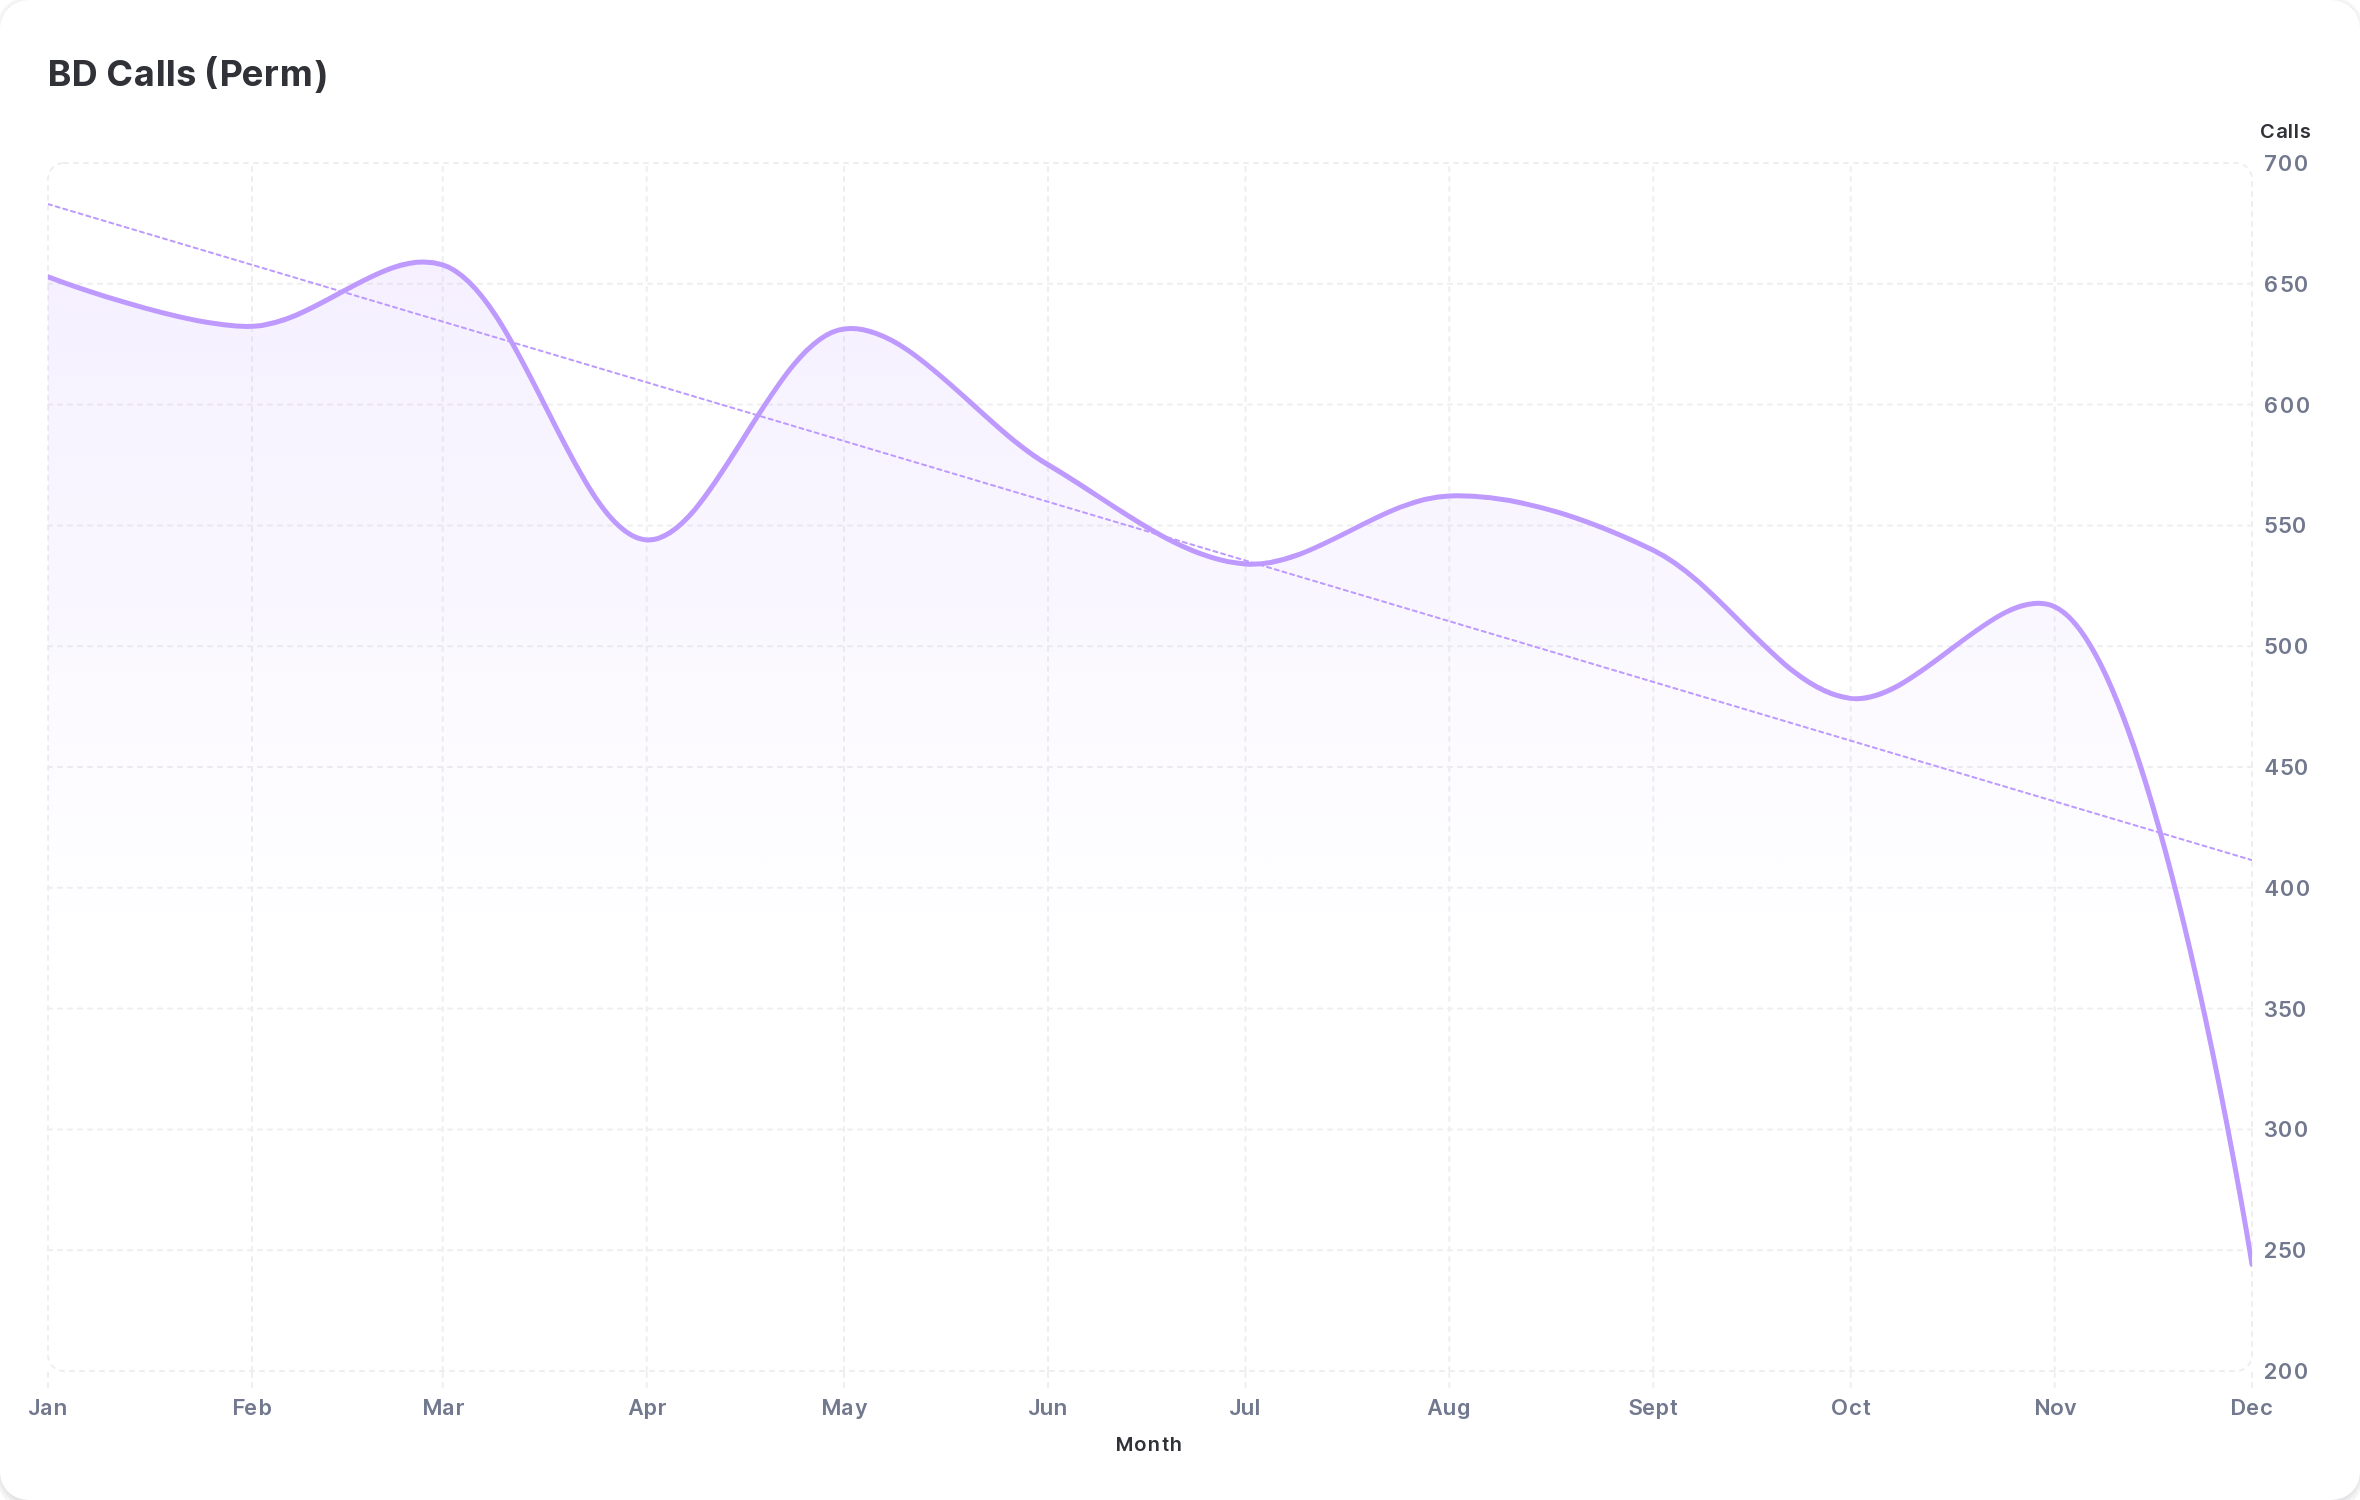
This report shows the average number of business development calls made throughout 2023. Across the whole year, the average was 547 per agency per month.
Q1 was also the busiest time of year for calls, with the number then trending down throughout the year. This is likely a reflection of agencies doubling down on client retention in 2023, instead of chasing new business, as employers tightened their belts in the face of economic headwinds.
Whilst it shows it was a challenging 2023 for winning new business, it also presents an opportunity for those who are willing to pick up the phone, with fewer agencies prospecting into clients as the year progressed.
Recruitment Pipeline Insights
BD Calls : Jobs Added — 7 : 1
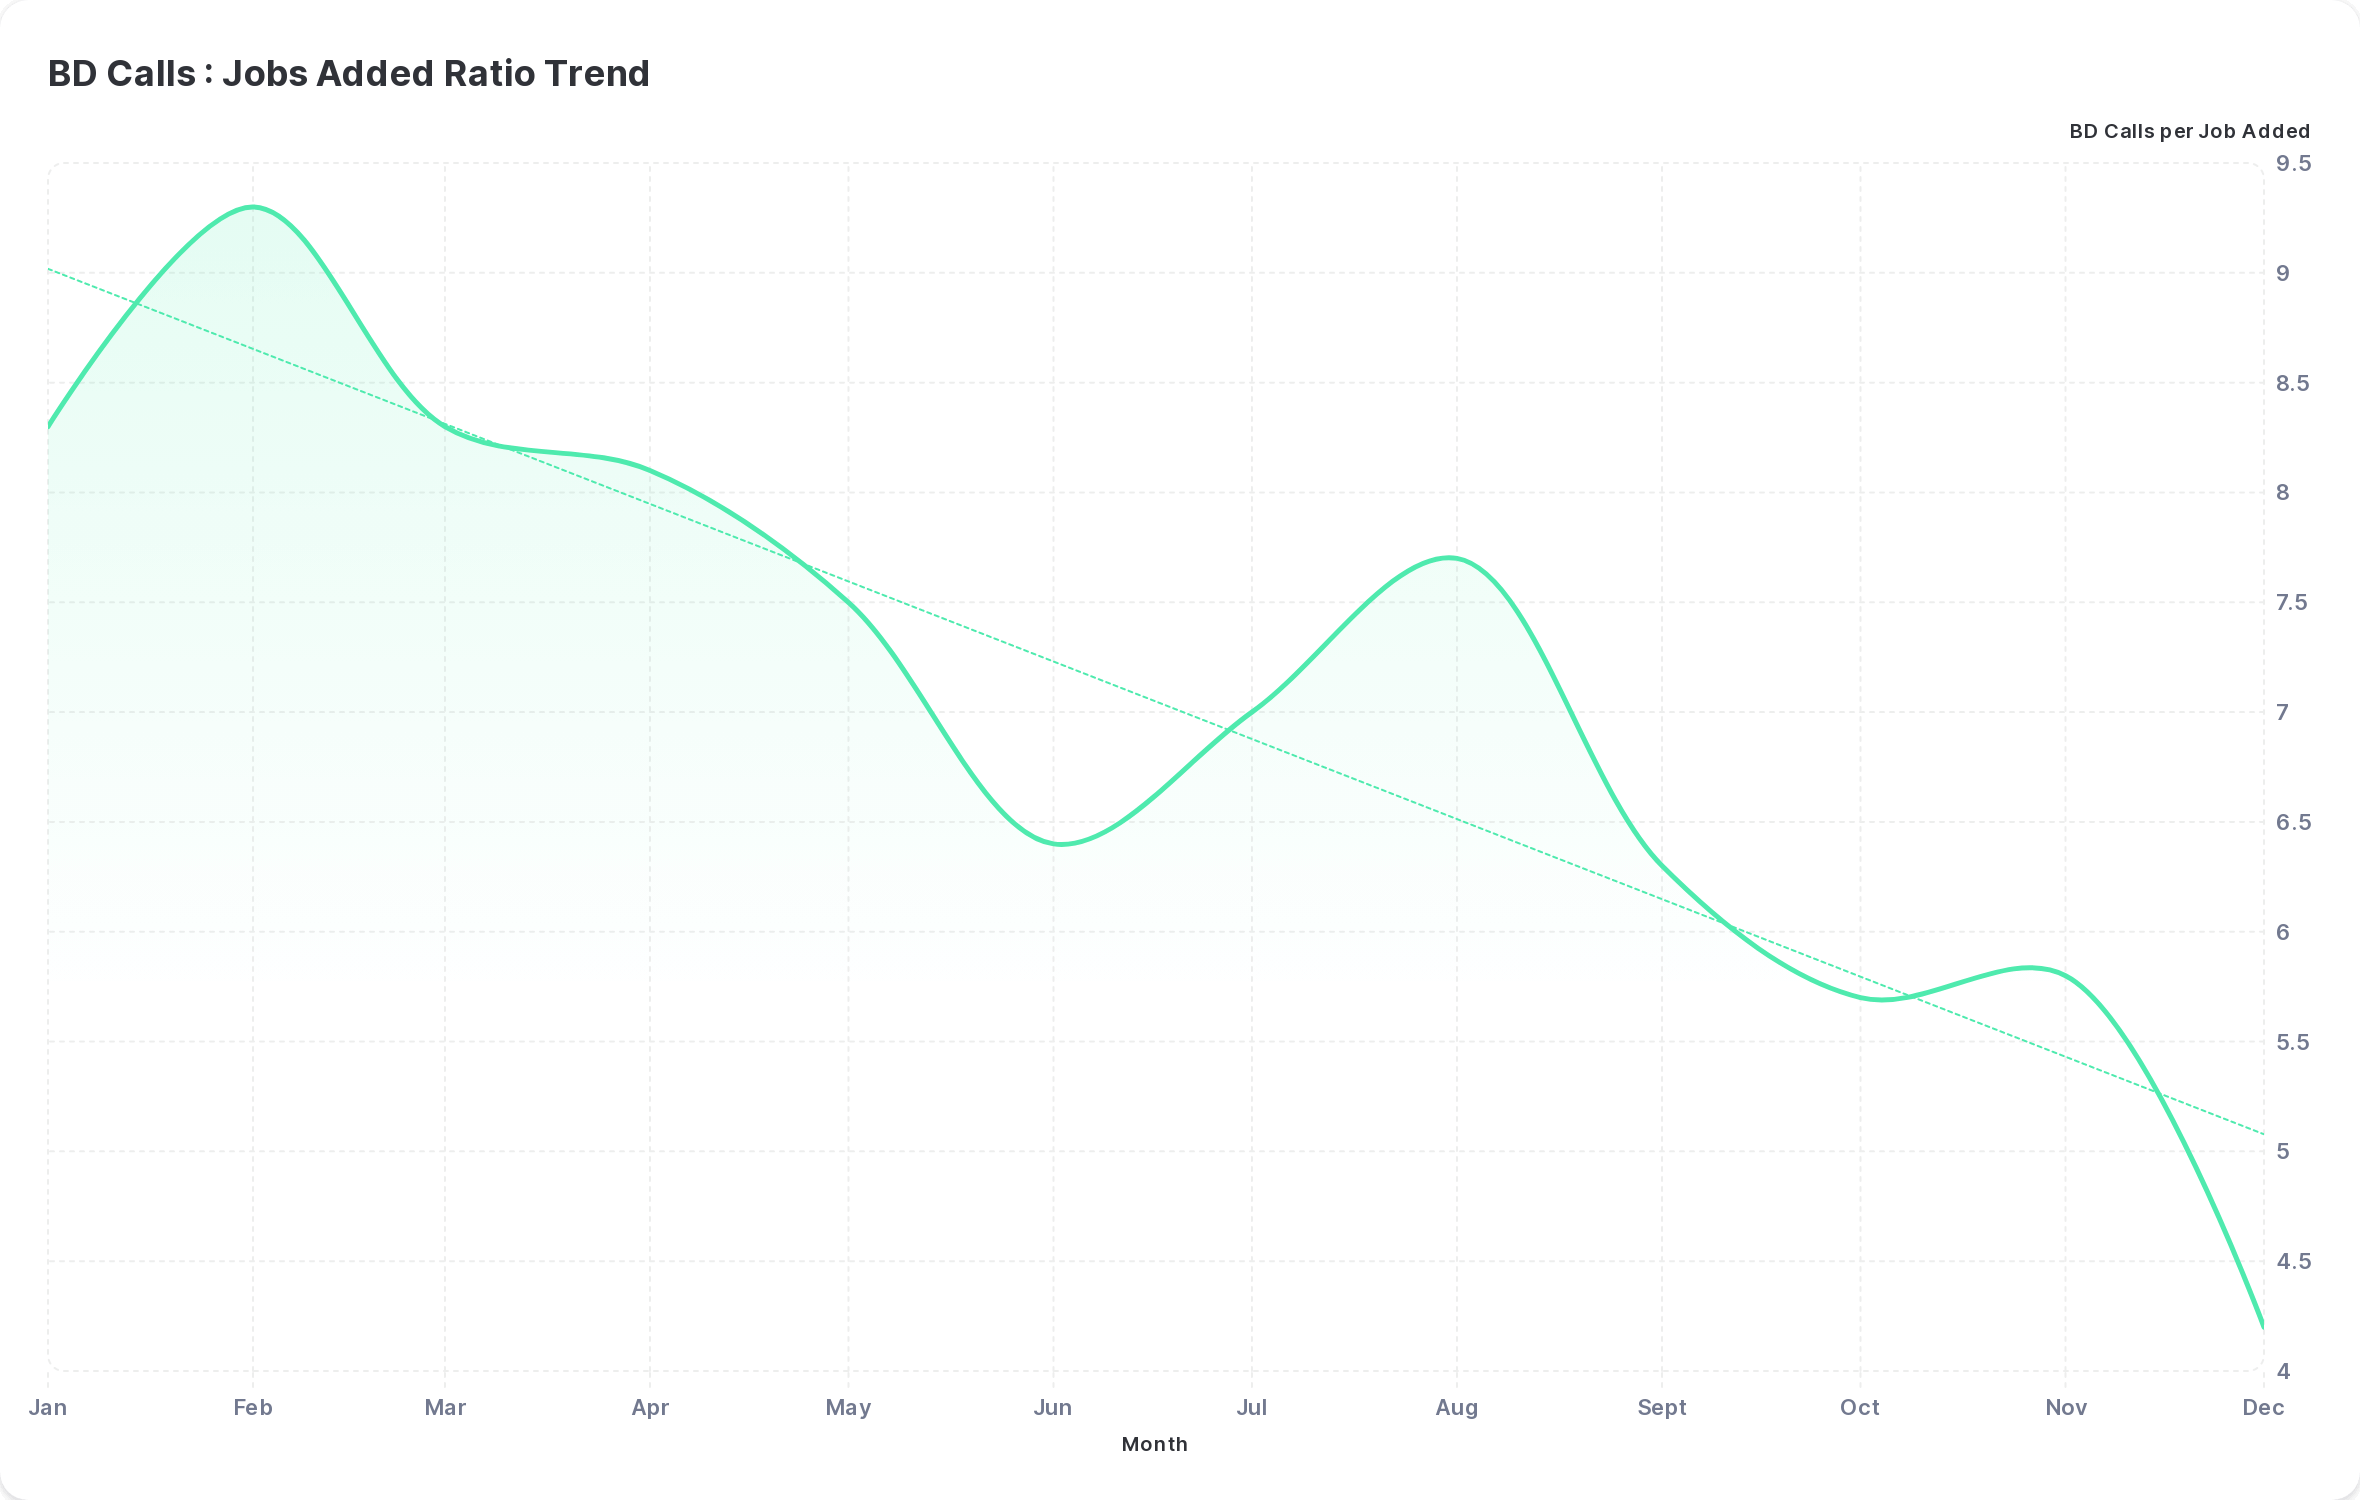
Across 2023 the number of business development calls required to add a new job averaged seven per agency per month.
This number however trended down throughout the year, from being above eight in Q1 to below six in Q4. This trend aligns with the fact that the number of BD calls being made by agencies declined through the year, while jobs added increased.
This indicates potentially less competition to win new clients in the second half of the year and an opportunity for those agencies and reps willing to pick up the phone.
CVs Sent : 1st Interviews — 3 : 1
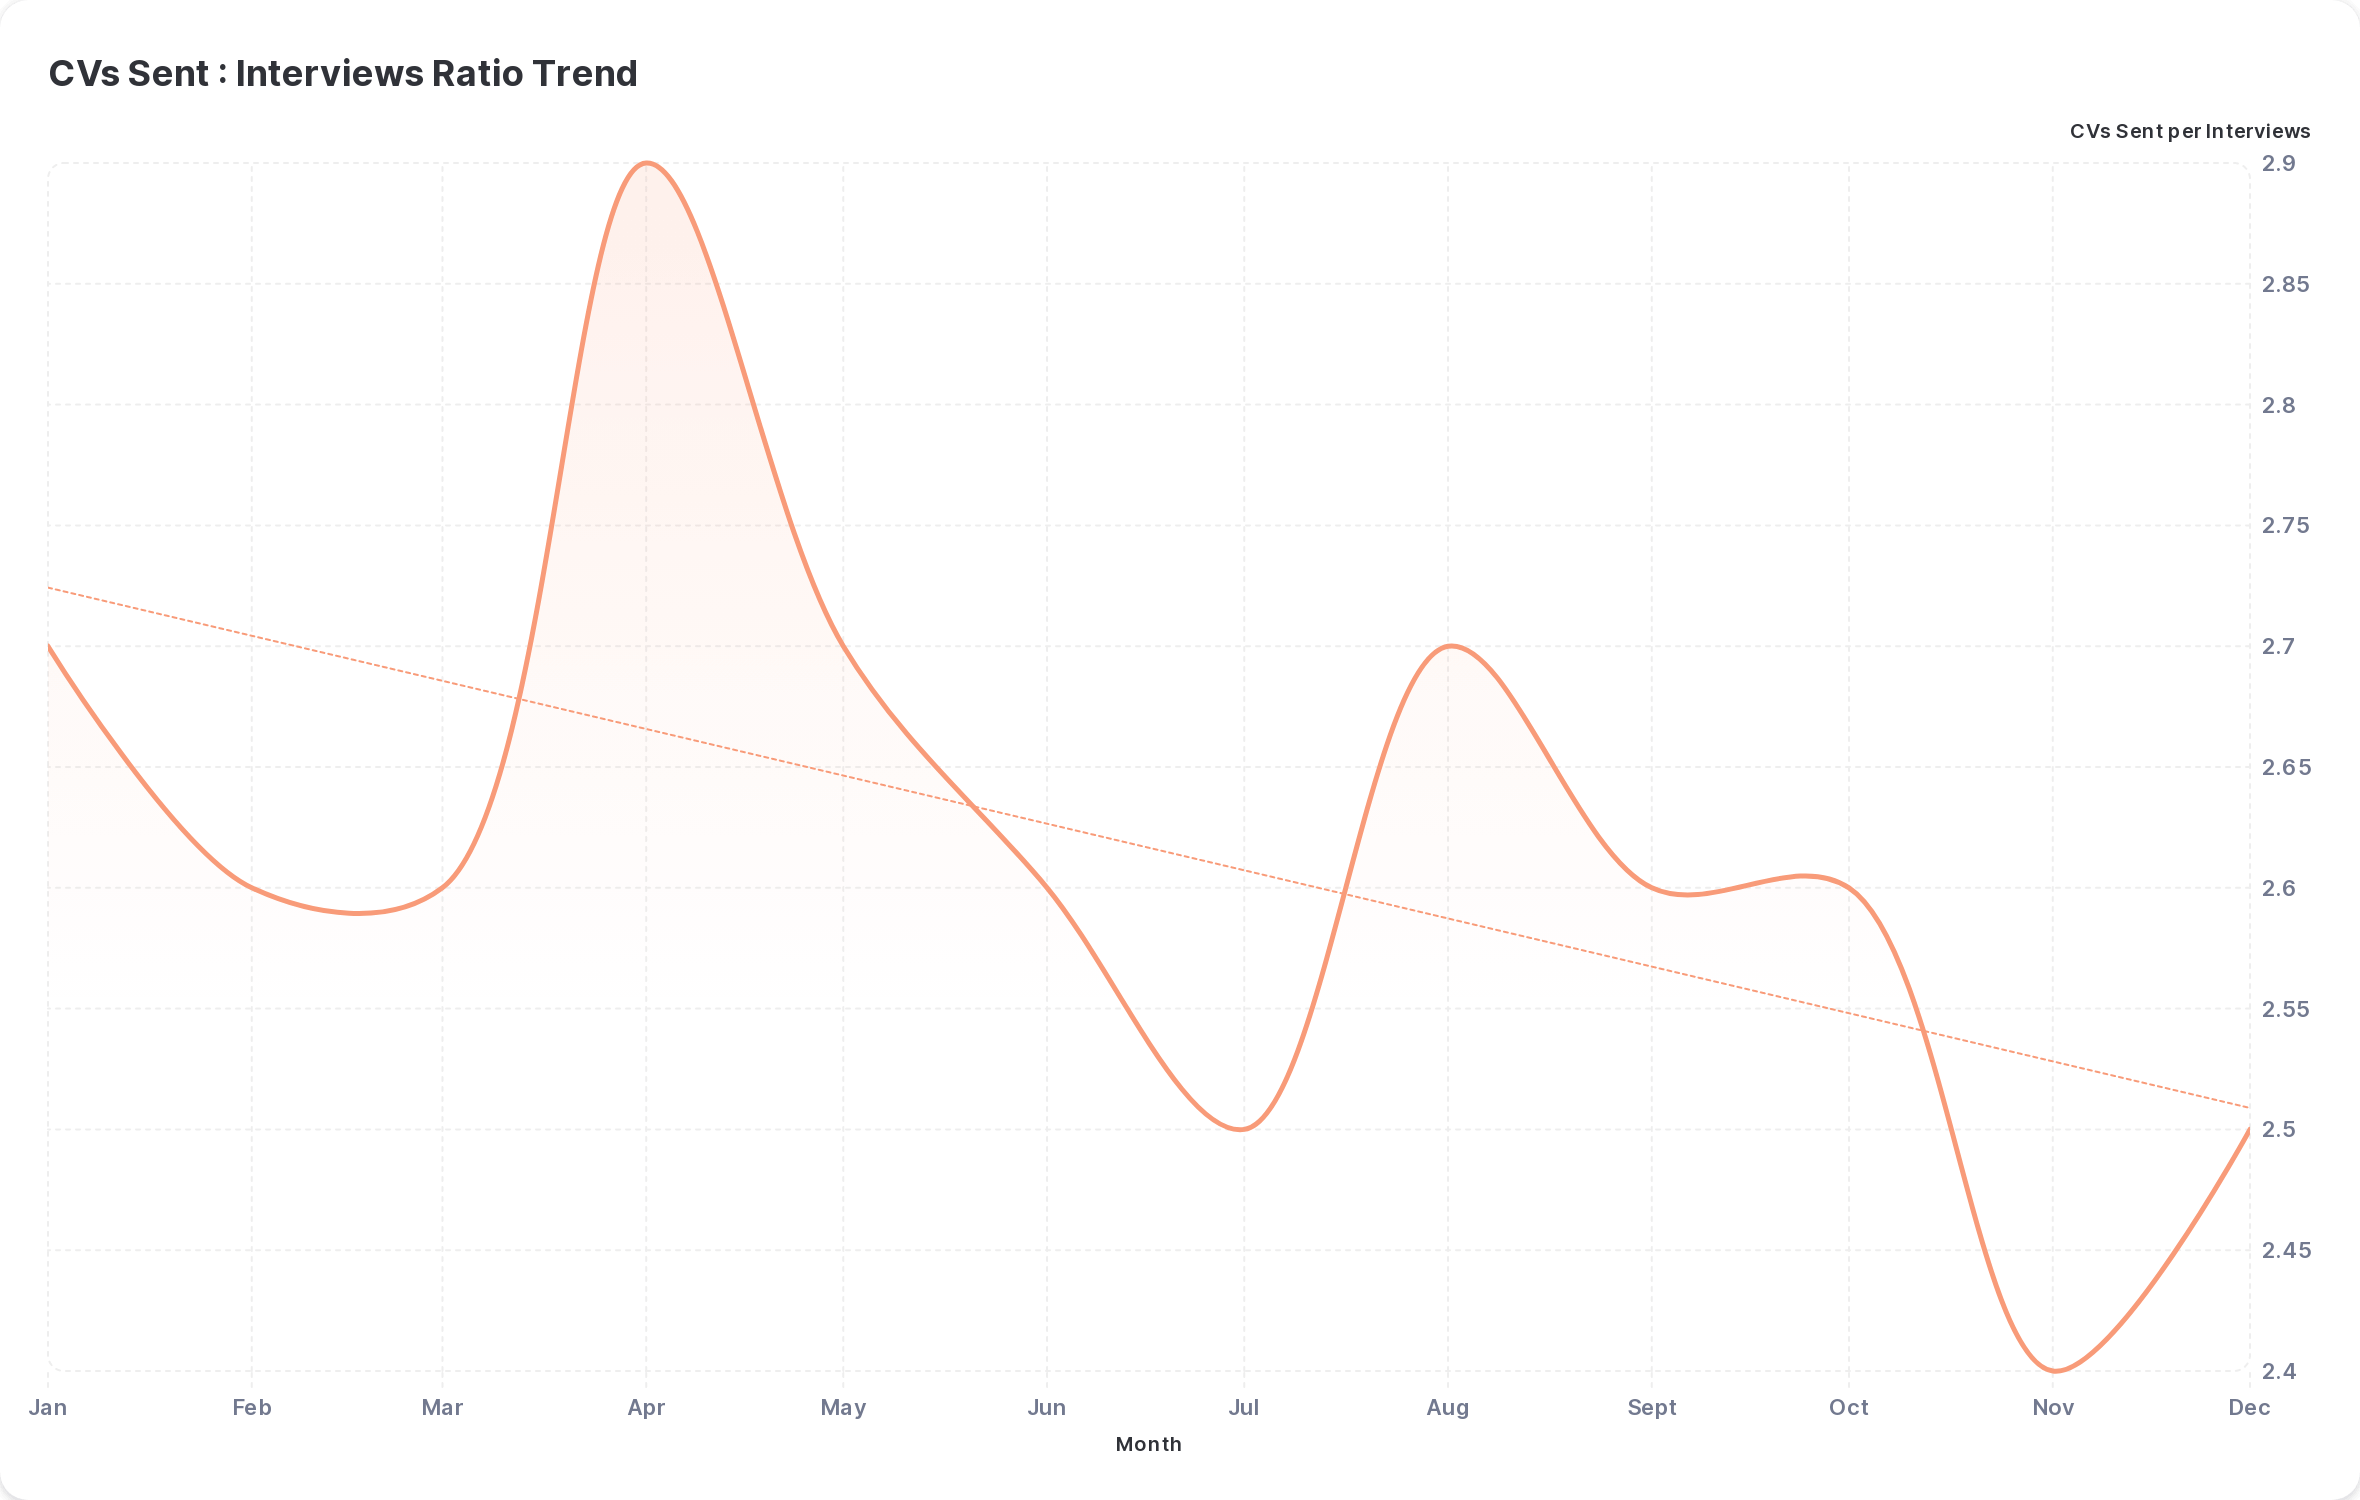
Throughout 2023 the number of CVs sent to a client required to successfully book a 1st interview averaged just under three per agency per month.
When we look at the data on a month of month basis, we see that this stays extremely consistent throughout the year.
While the number of jobs being added gradually increased throughout the year, the number of CVs being sent gradually declined. Therefore the number of CVs being sent to each open job as the year progressed also declined.
This indicates there’s room for improvement in the recruitment process and a stronger focus on leading activities could help drive down pipeline results. If reps can continue to source strong candidates and send CVs at the rate they were in Q1, more 1st interviews would be booked.
1st Interviews : Placement — 8 : 1
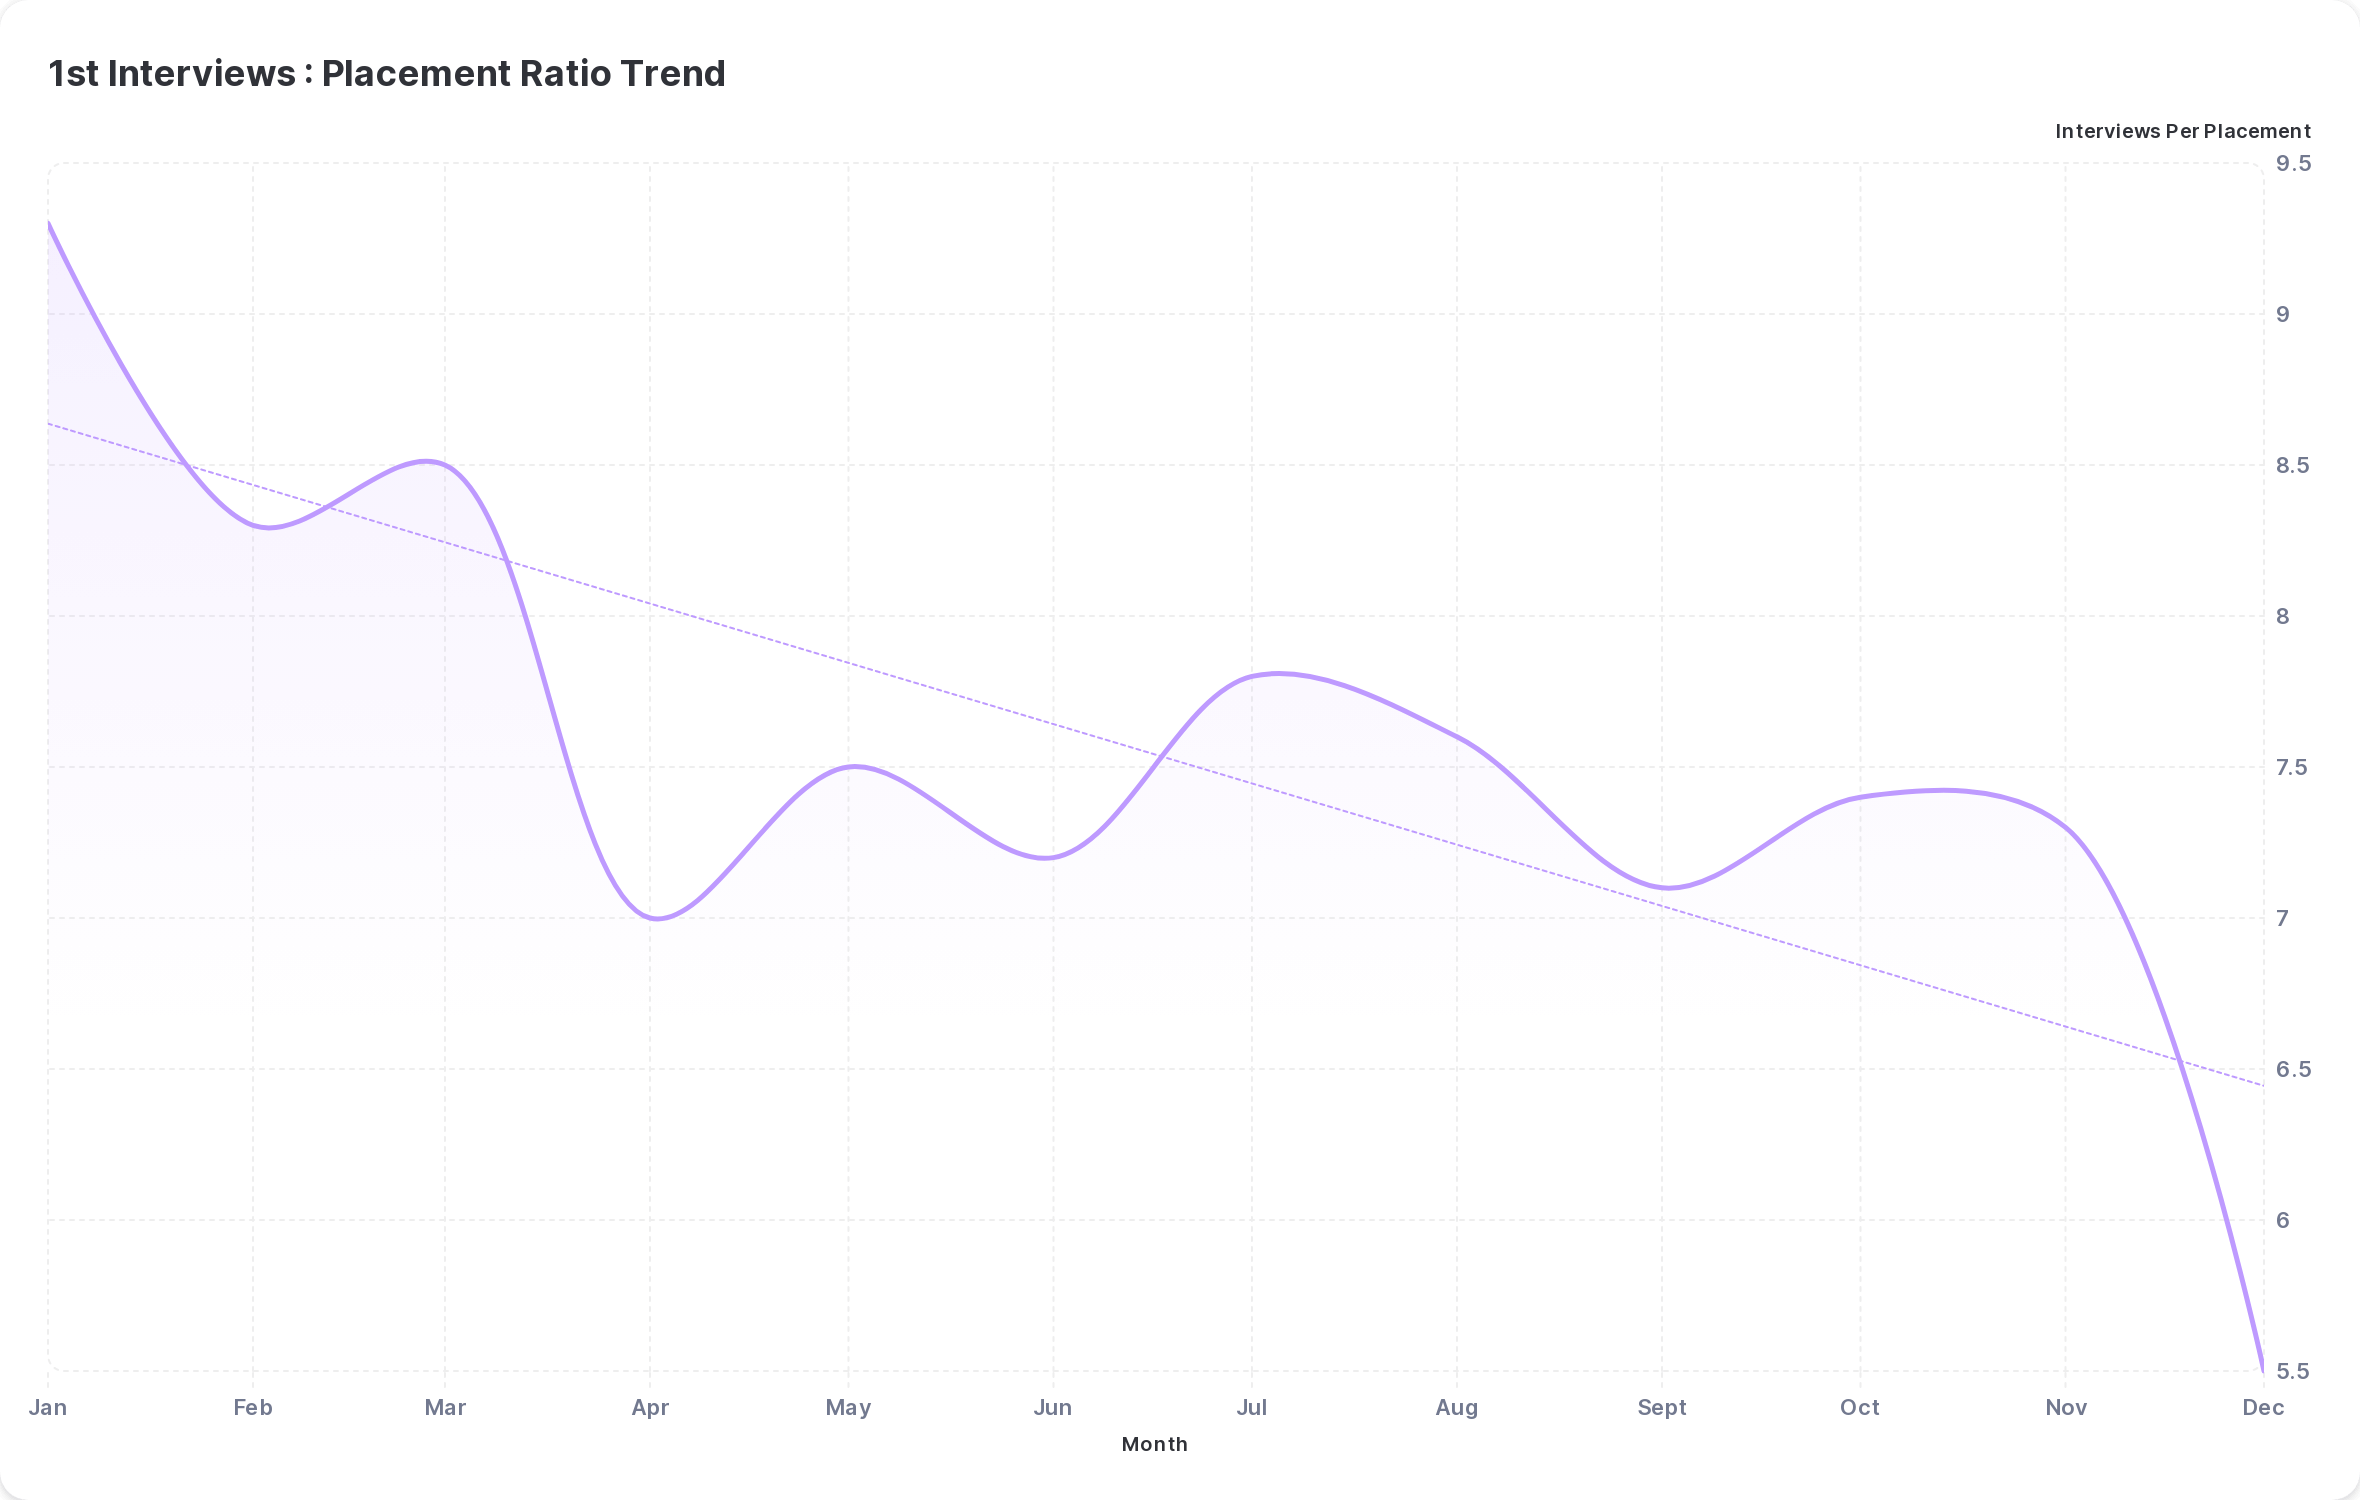
During 2023 the number of 1st interviews booked required to successfully fill a placement averaged just under eight per agency per month.
January to March saw the highest number of 1st interviews needed per placement, indicating a competitive market, at more than eight interviews required during this period. This drops afterwards and was closer to seven interviews from May onwards, but is extremely consistent thereafter.
As highlighted on the previous page, the consistency in the ratio between CVs sent to interviews, and interviews to placements indicates an opportunity in the recruitment process.
While the market is tough those reps that can continue to source strong candidates and focus on high-quality leading activities, such as sending the right CVs and booking interviews with clients, should see stronger fill rates.
Jobs Added : Placement — 7 : 1
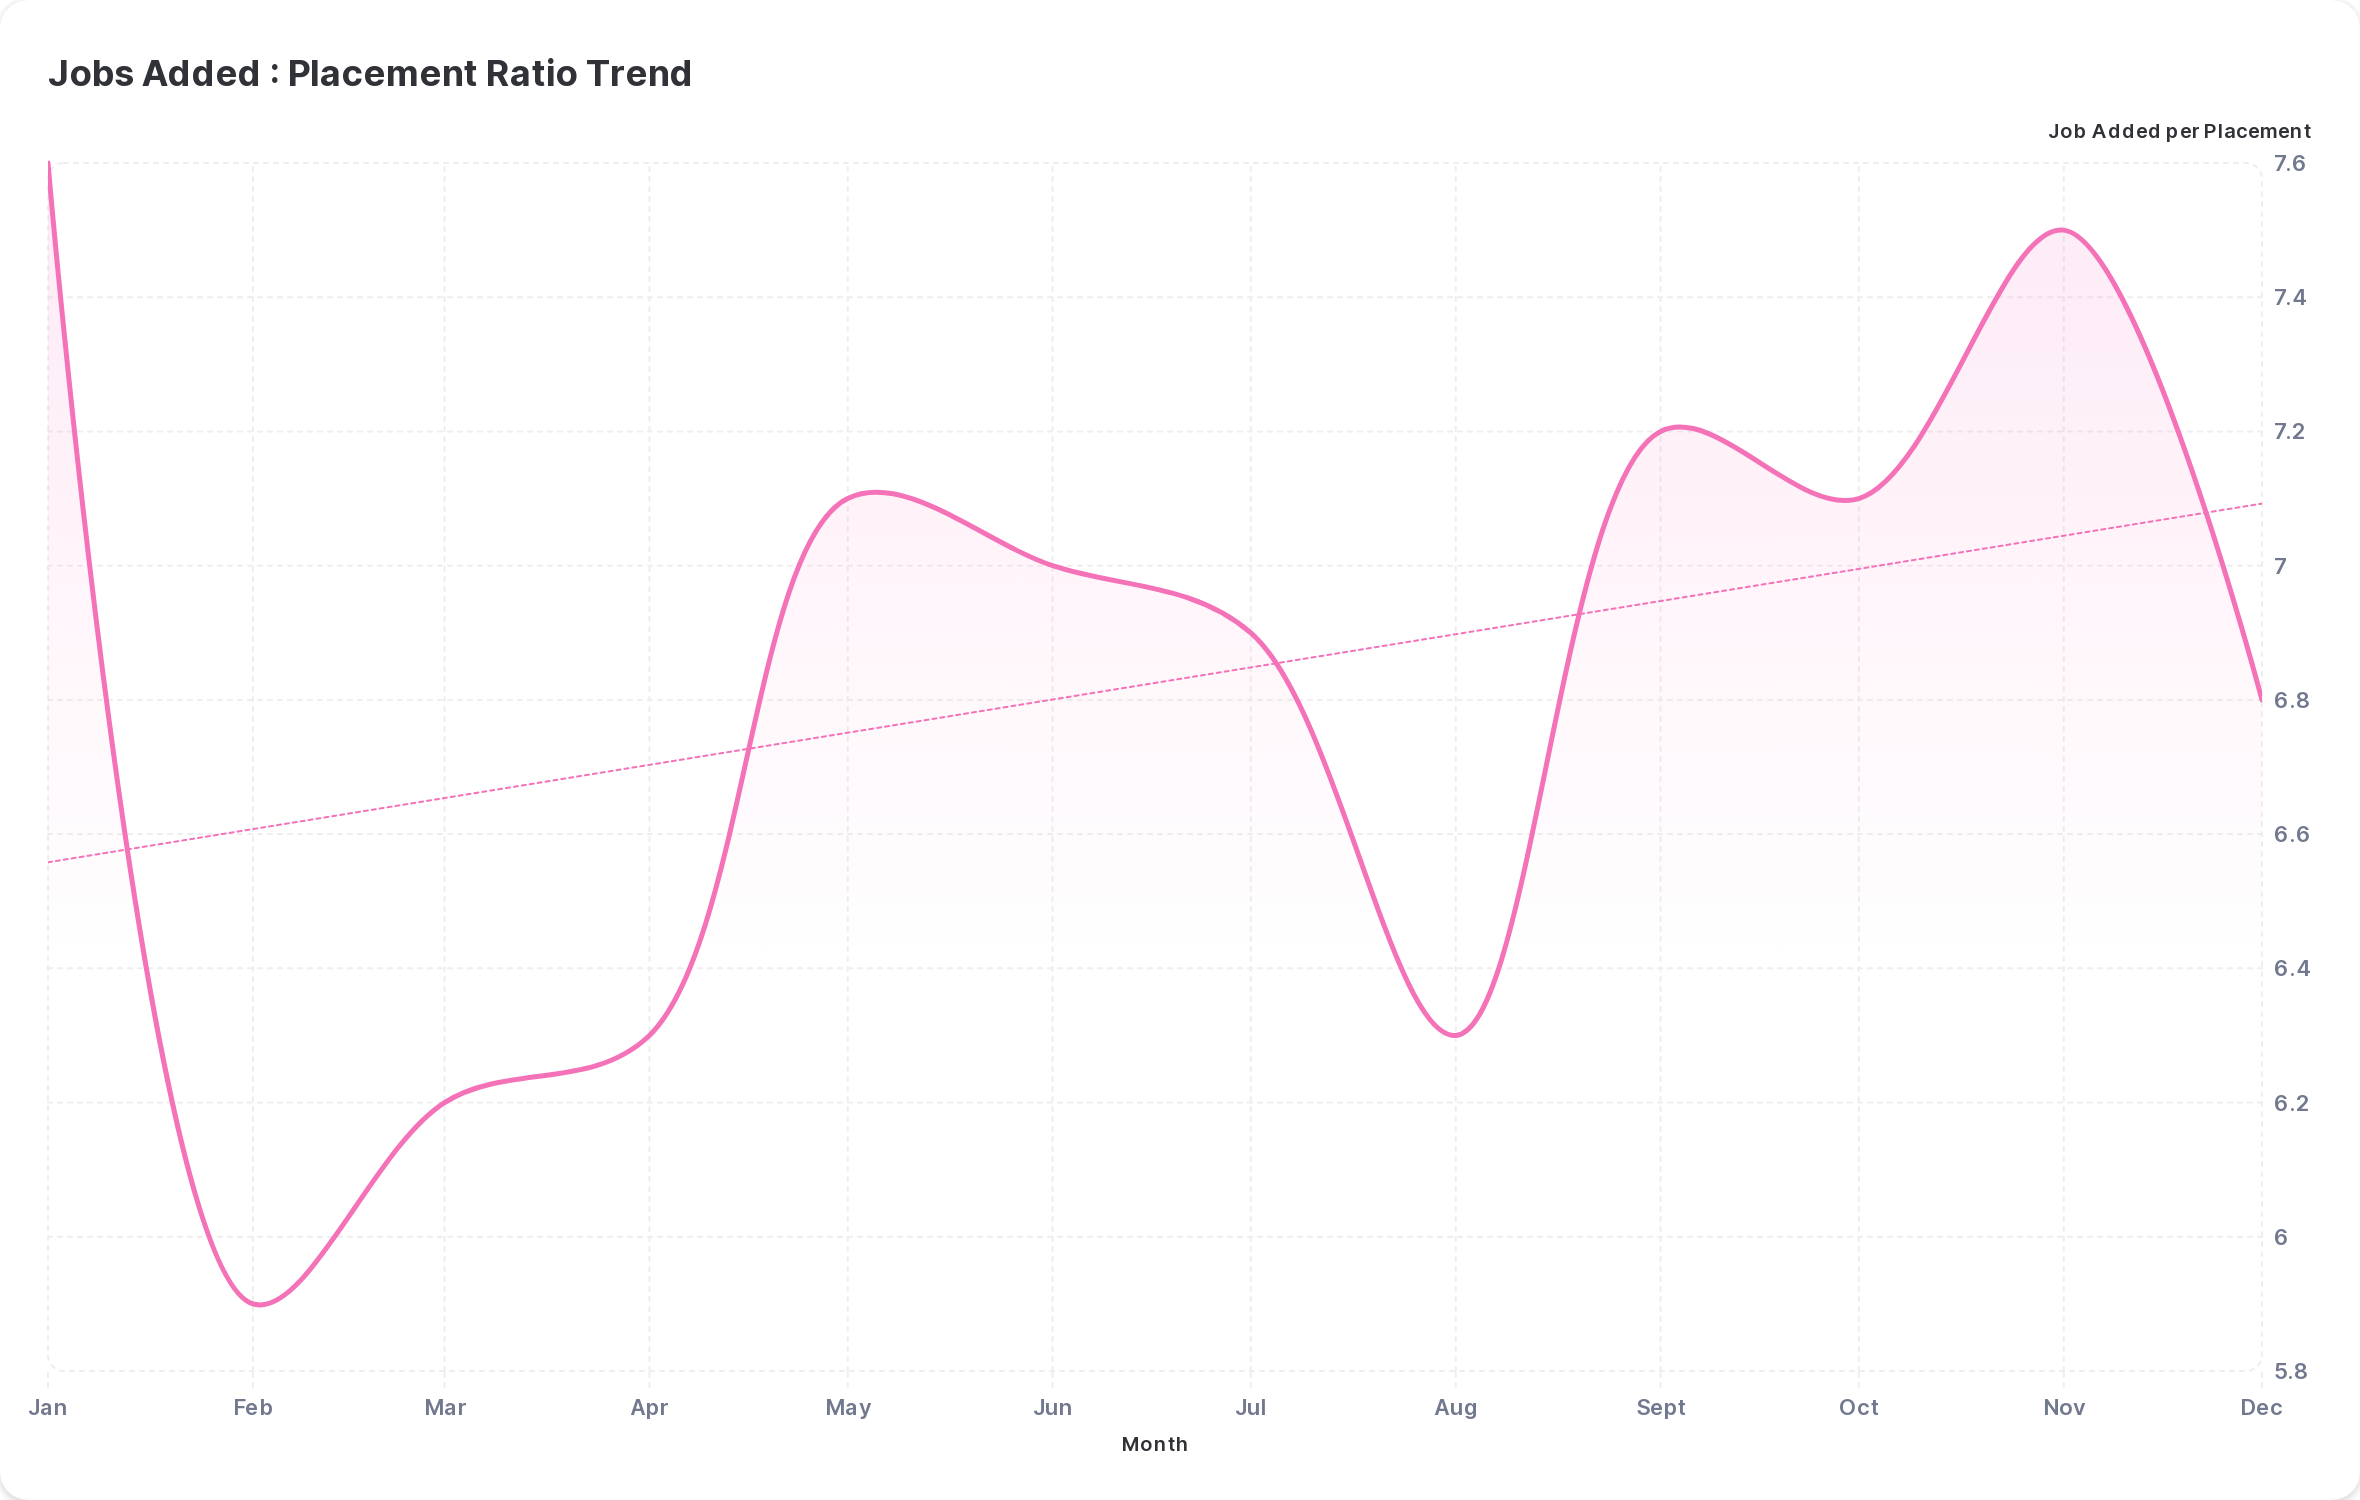
Across 2023 the number of jobs added to fill one placement averaged seven per agency per month.
This ratio trended up throughout the year, showing that while more jobs came on the market, successful placements did not follow at the same ratio. This suggests increasing challenges in the efficiency of recruitment processes as the year wore on and the economic climate presented a challenge for agencies.
This shows that understanding your recruitment pipeline dynamics is increasingly important right now, focussing on matching quality candidates with the right jobs is key, and ensuring your recruiters are focussing on activities that correlate with better fill rates will lead to more filled placements.
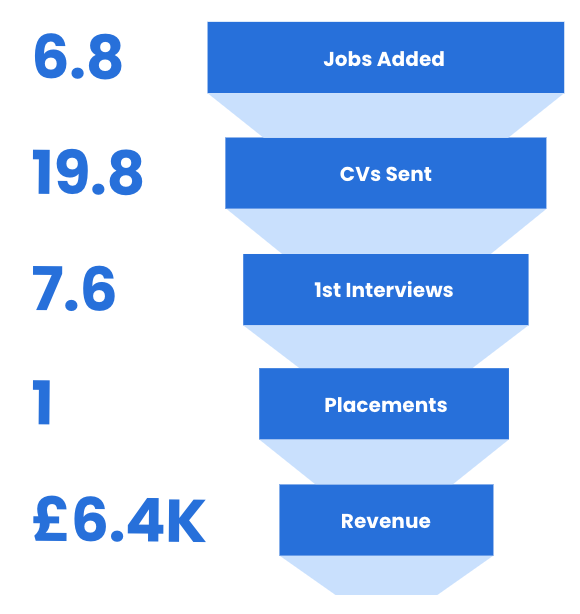
The Recruitment Funnel
What does it take to successfully fill one permanent placement?
While it’s important to remember each agency’s funnel will look slightly different dependant on factors such as industry, seniority of roles, and more, here’s a look at the average recruitment funnel for a permanent placement in 2023.
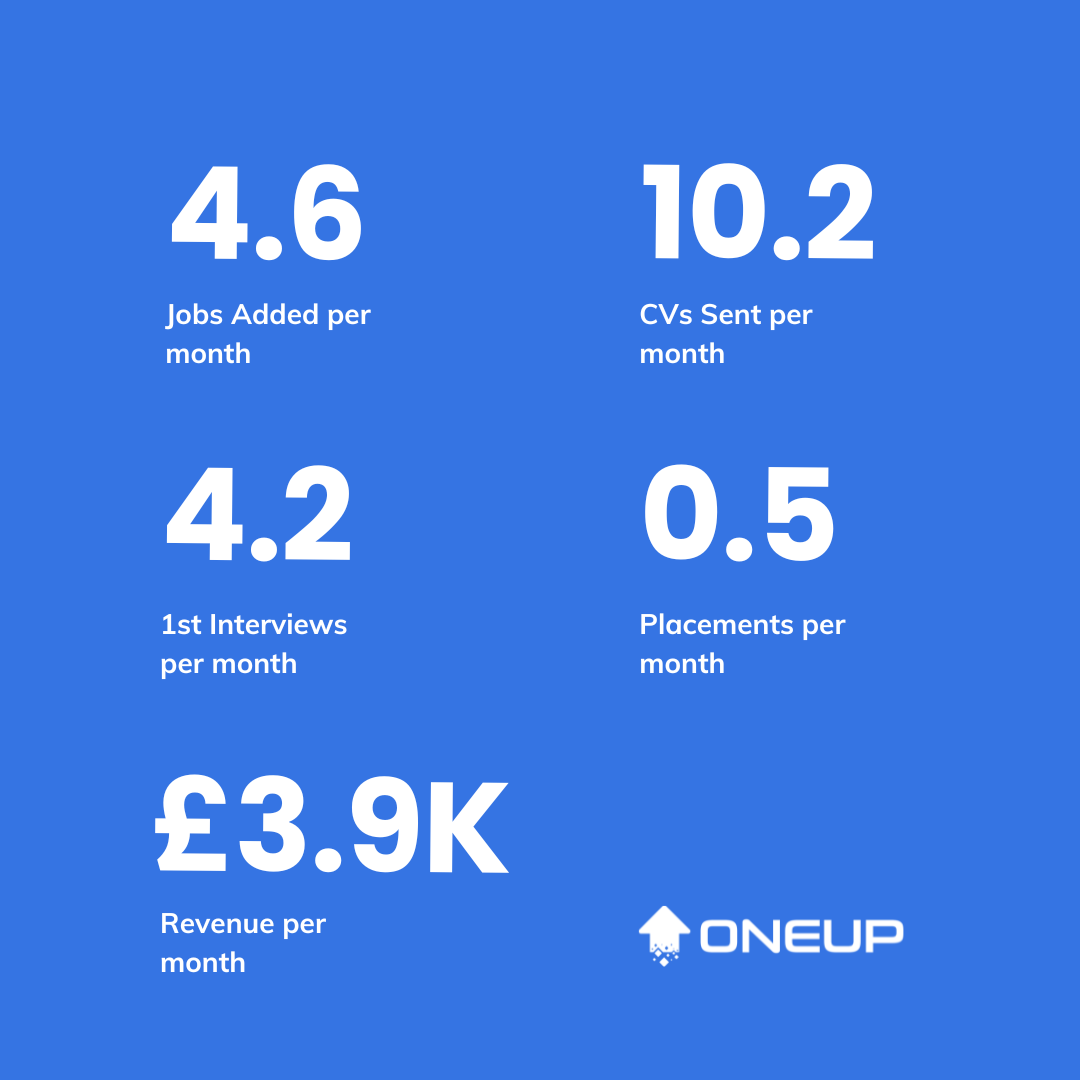
Recruiter Benchmarks
Goal-setting is instrumental to recruiter success.
Without targets to work towards, it’s near impossible to track your performance, to find out how you compare to other reps and agencies, and to identify what is — and isn’t — working within your strategy.
But for goals and targets to be effective, your benchmarking needs to be on point.
This is where industry averages can help.
The data shows that while the market has been tough, recruitment pipeline ratios stay extremely consistent. So ensuring your team is hitting target on those leading activities, should provide predictability in achieving revenue outcomes.
This means data-driven recruitment leaders will have an advantage over the competition.
In this section you’ll find benchmarking data on how the average recruiter performs each month on key pipeline targets for permanent jobs.
How do your recruiters compare?
How to use this data
While all this data is sourced from OneUp clients specialising in permanent recruitment — and trends will vary by industry, agency size, and other factors — the data does indicate one clear thing:
In 2024, recruiters need to make data-driven decisions.
As we’ve seen in the data, there’s a consistency in leading activities such as CVs sent and interviews booked resulting in placements filled and, most importantly, revenue.
But as 2023 progressed, the ratio of these high-quality leading activities to new jobs dropped off. Subsequently, the ratio of placements being filled dropped too.
Whatever the reasons behind the drop in this pipeline performance, it shines a light on how critical it is for recruitment leaders to have visibility into their data, in real-time, to understand what’s driving performance.
This will enable managers to set their team targets that drive revenue outcomes, identify pipeline issues as soon as they arise, and take corrective action. So, where do you start?
Managers need to set their team smart targets based on high-quality leading activities — and then empower reps to work towards them by giving them visibility into their progress.
Meanwhile, team activity and progress should be tracked in automated real-time dashboards. This empowers leaders to instantly identify blocks or leaks in the recruitment funnel and proactively dive deeper into the data to pinpoint what’s working and what isn’t.
Go one step further and incentivise your team to hit their targets too.
This can be achieved through transparent team leaderboards that tap into your recruiters competitive spirit.
Leaders that leverage this kind of innovative technology to empower their teams will be a step ahead of the competition when it comes to taking advantage of a market rebound as 2024 progresses.
Wondering where to get started?
OneUp gives you visibility into all your recruitment data — in real-time — in simple-to-use dashboards, that can be customised for leaders, managers, and reps.
Track all your recruitment pipeline metrics in one place, automate your most important weekly reports, and get back to hitting your targets.
Book a demo or take a product tour to find out more.