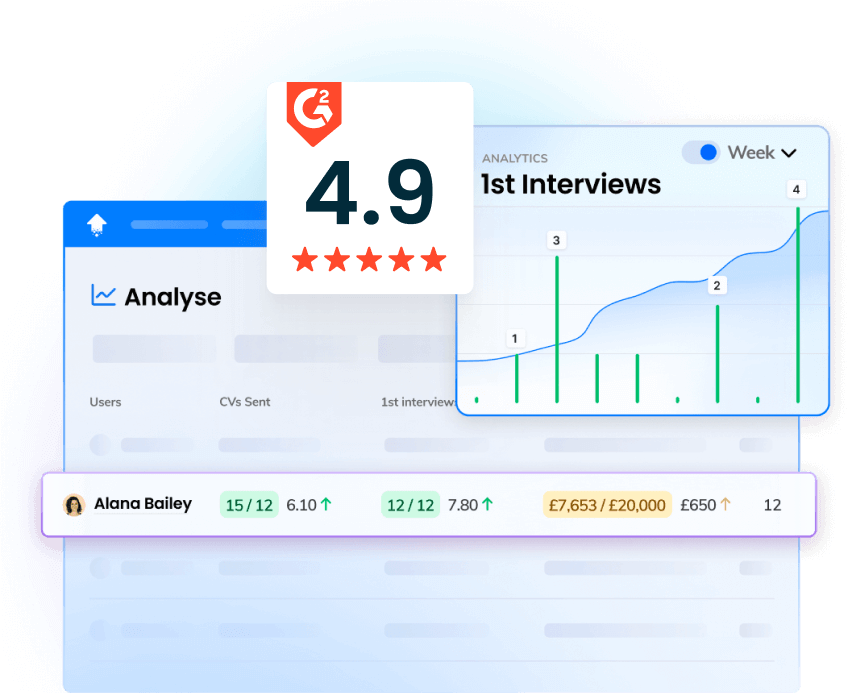
Running a business can be hard, we get that, especially in these uncertain times. That’s why at OneUp we‘re always trying to make your job easier so you can focus on what really matters, motivating and training your staff and bringing in the 💵by bringing the power of analytics onto the Matrix.
In an effort to make it even easier to manage your sales team we have just dropped our biggest release ever. Introducing the Matrix, version 2.
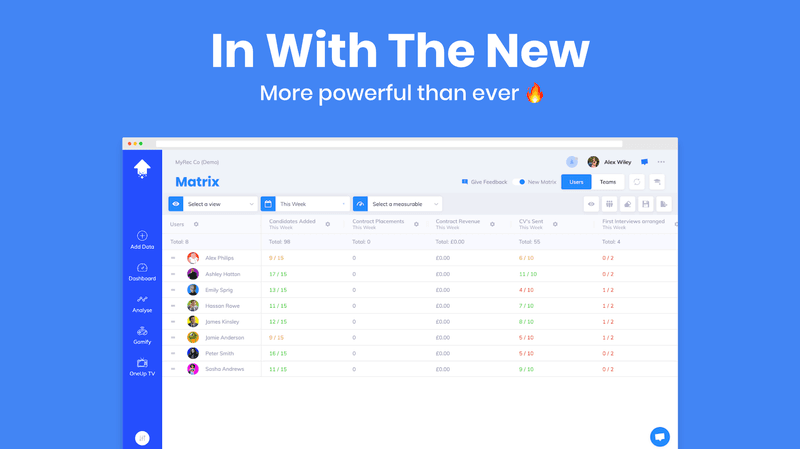
When setting out on the task of redesigning and developing the matrix we wanted to stick to the following core objectives:
- Managers should have access to the data that matters to them most at a glance.
- Managers should be empowered to dive deeper into their numbers without having to leave the product.
- Every company has different needs, the matrix should be flexible enough to cater to all needs.
Today we’re launching a new series of blog posts to introduce you to the newest and best additions we’ve made to the Matrix and we’re kicking it off with one of our most highly requested areas, analytics.
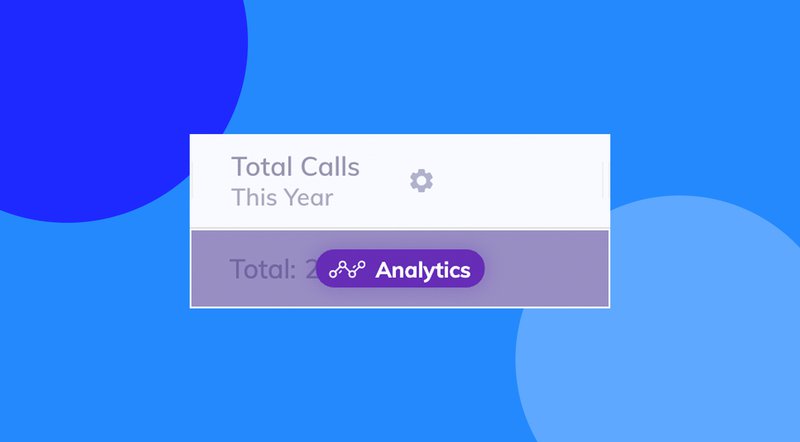
Analytics On The Matrix
We’re really excited about the advancements we’ve made with analytics on the matrix and we think you’re going to ❤️ them. This year we introduced an exciting new package to the OneUp platform, Data Insights (more on that in a bit!). In addition, we’ve also rebuilt charts on the matrix from the ground up. Both charts and Data Insights are bundled into one new modal, Analytics.
Charts In Analytics
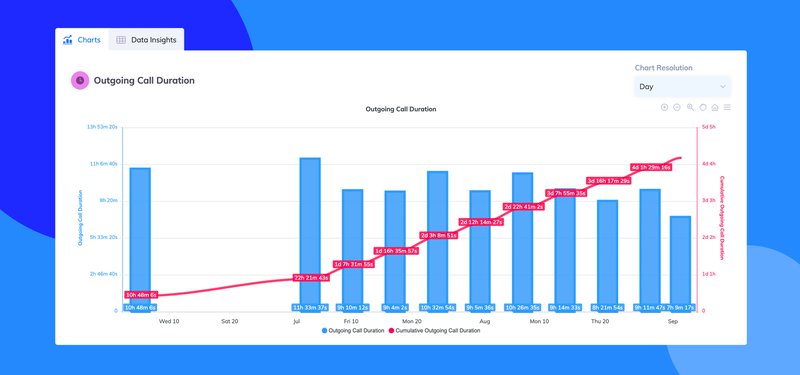
Sometimes it’s not just the number on the surface that you care about, you need to see how that number has changed over time. With charts, you can click onto any figure on the matrix and instantly see a graph representation for how that figure was made up over the set time period. This gives you the ability to:
- Spot trends immediately,
- See a time-based representation of your data at a glance.
- Interact with the graph and drill down even further
As a bonus, you can also export this chart as an image! See the download options under the chart hamburger icon in the top right.
Data Insights In Analytics
With our Data Insights feature, we aim to solve one core need; allow our users to dive deeper into their data beyond the surface figure. Perhaps you want to see the value of a certain deal? Maybe you want to see which customers have contributed to your revenue figure this month? It’s all possible with Data Insights.
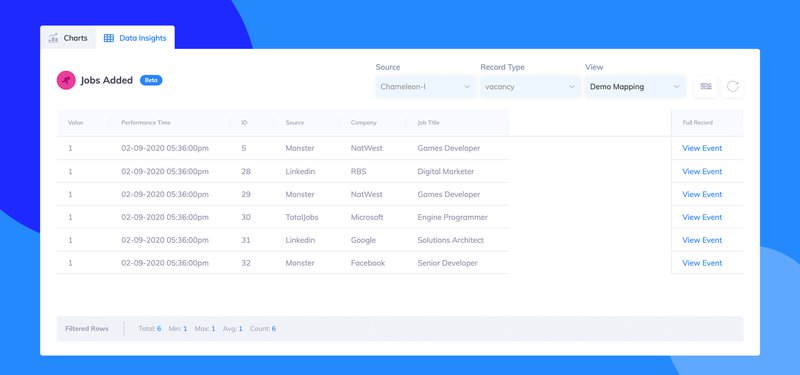
Switching to the Data Insights tab in the analytics modal will show you a table representation of the data you have selected, allowing you to dive deep into the records that make up the figure shown on your matrix. You can use the table filtering on the column headings to filter the rows accordingly. Looking for specific clients deals? This is the place to do it.
If you would like to customise the columns that get displayed, let us know! We’d be happy to set this up for you!
Total Cell Insights
In addition to being able to drill down into any figure on the matrix, we’ve also added the ability for you to be able to launch the analytics window on the total cell for each column. This allows you to easily see a charts or data insights table for all the users in your matrix table at once. How nice is that!
That’s A Wrap 🌯
We hope you learnt something from this, next up we’re going to be talking about the power of views on the Matrix. Stay tuned for more 🚀
You can check out all of our solutions on our website!