Today is the final instalment in our series of blog posts focussing on the awesome new features and updates we’ve brought to the Matrix - a core component of our sales performance management platform.
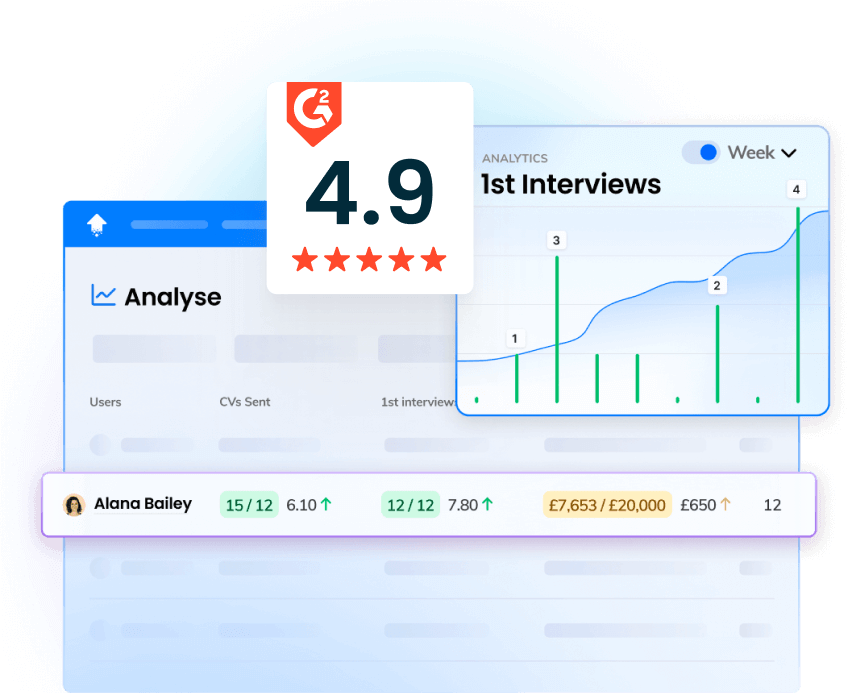
For prospective clients unfamiliar with our product, this powerful tool pulls and displays data from a variety of sources, allowing you to analyse and craft reports on individual users and larger teams, for a wide range of different metrics.
The Matrix thereby empowers sales managers and consultants across the world to get the best out of their team, and fulfils our mission to make working both fun and enjoyable.

Do you want to feel like a master of the Matrix? Once you’re equipped with all of our new features, your team will be so quick to dodge inefficiency and common pitfalls in recruitment and sales, that they'll be sure to feel like Keanu Reeves himself!
More Intuitive Columns 💥

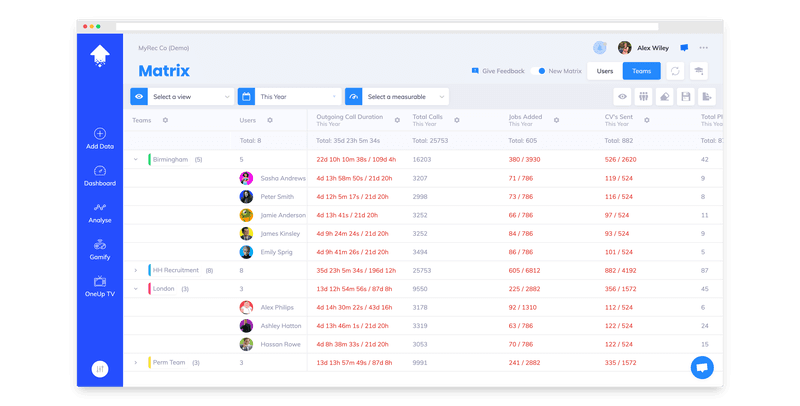
One of the most powerful things about the Matrix is how customisable the columns are. We give you the ability to change a columns date range, the sort column data, and duplicate and delete columns. With the new version of the Matrix, column settings can easily be accessed by clicking anywhere within the column header. A sleek tooltip will pop up allowing you to select whatever option your heart desires 💕.
We’ve also made it really easy for you to change the layout of your columns. Now you can simply hold and drag-and-drop a column by its column header to anywhere on the matrix, and it will re-order the column to that position. In addition to this, columns can now be pinned; to pin a column drag it over to the far left next to the user’s column and it will stay pinned on your Matrix.
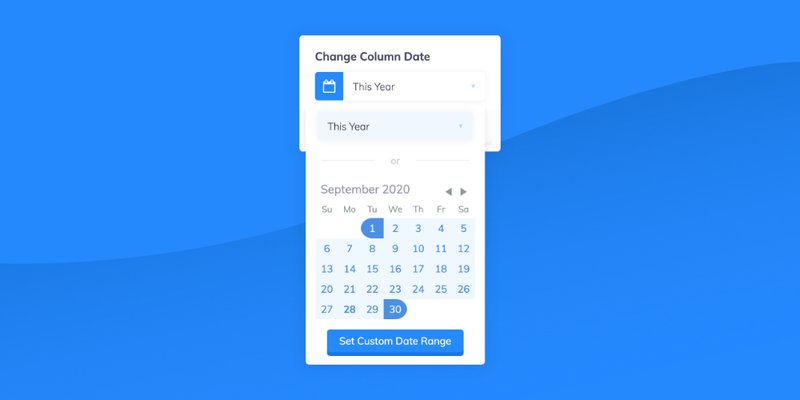
We've also made it easy to change the column dates on a column-by-column basis. Clicking the calendar icon in the column header tooltip will launch our date picker, allowing you to select either a set time period or any custom date you like.
A great use case for this is the ability to pull a metric onto the Matrix, duplicate that column, and see side-by-side a comparison between the data across this week, this month and this year. No matter which way you like to structure your reports, the Matrix has your back.
Clean Your Slate 💨

Sometimes it can be easier to simply get rid of everything instead of improving what’s already there. Just like a building with bad foundations, sometimes you need to demolish it all and start over again.
Previously this was only possible by individually removing each column header, which was unnecessarily time consuming. Now there is a "Remove All Columns" button which instantly removes all of your columns on the matrix. We just love saving you time ⏳!
Easy Export

The Matrix is an amazing tool for being able to dynamically see all of your data in realtime. We’ve seen first hand how it has completely revolutionised teams around the world and we’re really proud of it.
However, sometimes you may want to be able to utilise that data outside of the platform. Perhaps you’re preparing an upcoming board report or maybe you want to send it around to some people who aren’t part of OneUp. Whatever your use case, we’ve made it really easy for you to get your data in two formats - Excel and CSV.
From the action bar on the matrix, select the export icon and you’ll be presented with the above export modal. Select the file type you would like and export away - we’ll save the file directly to your computer.
Seamless Transition Between Users & Teams

All companies are comprised of individual teams and departments in one form or another. This is why teams are used so much on the platform - they simply mirror the real-life structure of your company.
For that reason, we know how important it can be to report not only on individual performance but also on a teams performance as a whole. Perhaps you want some insight into how your London office is doing compared to the San Francisco one? Switching to Teams on the Matrix has got you covered.
The teams view automatically groups your users by their team allowing you to see a grouped view of how each of the teams in your organisation is performing. We’ve made it really easy to quickly switch between your users & teams view by using the toggle on the Matrix.
That’s All For Now 🥂
And that’s a wrap! We’ve really enjoyed delivering this deep-dive series into the Matrix and we can’t wait to see how you use it.
OneUp Sales - building high performance sales teams by increasing productivity, retaining talent, and empowering management across your organisation.
Download our brochure to learn more about our platform, or watch our demonstration video and explore what it could do for you.