
The days of staring at incomprehensible spreadsheets full of pivot tables are long gone.
For years, talent acquisition teams worked with inadequate data systems, which seemed almost impenetrable for employees without data science expertise. This erected barriers to recruiters capitalising on data insights: it was a time-consuming and confusing process and recruiters felt they had more important tasks to be getting on with.
Yet the dawn of the recruitment analytics dashboard has been a complete game-changer for performance improvement in modern talent acquisition.
Instead of working with myriad clunky tools, recruiters can now easily access all their data in one place — on a streamlined recruitment dashboard with beautiful, easy-to-interpret visualisations.
And recruitment agencies that don’t harness the power of data dashboards to save time and boost performance risk being left behind in an ever-more competitive sector.
So how can you empower your recruiters through dashboards?
In this article, we will guide recruitment professionals in designing dashboards that enhance data interpretation and strategic decision-making.
If that sounds helpful, read on to find out more.
The Role of Dashboards in Recruitment Analytics
Dashboards transform raw, real-time recruitment data into actionable insights.
Recruiters can use custom dashboards to track a wide variety of metrics. The metrics they choose to track will depend on the nature of their own role, the needs of their clients’ hiring managers, and any pain points they need to overcome to hit their goals.
By setting up a dashboard for recruitment with clearly defined purposes for specific metrics, recruiters can easily spot trends and patterns within the data. The data visualisation makes it clear — at a glance — when a recruitment process isn’t working as it should be, when targets are being missed, or when a recruiter is underperforming.
From these dashboard recruitment insights, they can then make confident, data-backed decisions on what action to take to resolve the problem.
For example, a recruiter may choose to track their recruitment funnel for a specific client. They might track the number of applicants in their funnel, the number of interviews that have taken place, the number of assessments that have occurred, and the number of hires that have been made. It may also track the average time that it takes for candidates to move from one stage of the funnel to the next.
Looking at the recruitment funnel dashboard data visualisations, it is super easy to see if there’s a fault in the funnel — and how to fix it.
If, for instance, the number of applicants is very low, despite the fact plenty of vacancies remain, the recruiter will need to dedicate more time to sourcing qualified candidates.
On the other hand, if there are plenty of applicants but the number of interviews is very low, there may be a problem with the quality and fit of candidates.
Data Visibility in the Recruitment Process
Unfortunately, recruitment teams currently struggle from a lack of data visibility and, therefore, insights into their performance.
Why?
- Outdated systems such as recruitment CRMs
- Manual tools such as spreadsheets
- Overly complex tools with a steep learning curve
Not only does this mean they waste time building manual reports and attempting to derive insights across a wide-ranging tech stack — but strategic decisions are based on gut feeling.
This is unfair to recruiters — they’re not being given the tools they need to outperform well-equipped rivals at competitor agencies.
It’s enough to make any busy recruiter completely disengage from data.
In the challenging recruitment landscape of 2024, insights are crucial — and the ability to build, access, and use custom dashboards is instrumental to data success.
To overcome these common data visibility challenges, invest in leading recruitment analytics software such as OneUp, that comes with outstanding dashboard capabilities.
Implementing effective dashboards will have a positive impact on strategic decision-making, recruitment team motivation, and performance optimization.
How?
You no longer have to rely on gut instinct alone to make strategic decisions. Instead, you can be confident in making moves that are clearly supported by data and therefore, much more likely to have a positive outcome.
What’s more, having access to clear data visualisations makes it much more likely that you will notice the need to make changes.
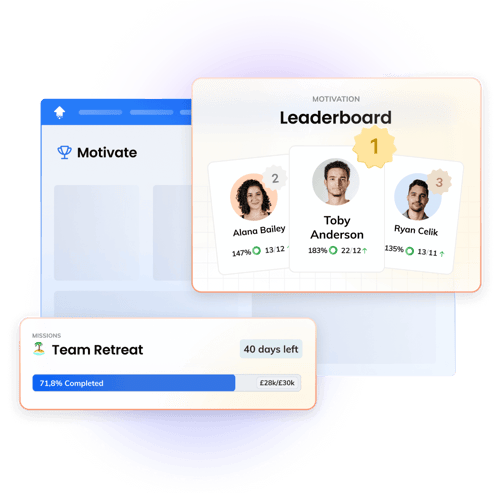
Furthermore, recruitment leaders can set up team dashboards that display real-time data surrounding various targets that compare recruiters’ performance.
For instance, you might set up a target of ‘20 positions filled’, with a visual display of team members’ progress towards that goal. When the goal is hit, celebrate their success!
You can use these dashboards to foster healthy competition, bolster team spirit, and optimise performance.
Types and Examples of Recruitment Dashboards
There are many common dashboards frequently used within recruitment. And within those dashboards, you can select from a huge number of specific metrics to track — allowing you to get as granular as you like.
Different dashboards are typically set up for employees in different roles — for example, agency leaders will need a more zoomed-out overview of performance, while individual recruiters must deep dive into the nuts and bolts of their processes.
Dashboards are used to track both team and individual performance against personal development milestones, as well as to look at overall hiring progress and goals. Recruiters working on large client projects may also set up individual dashboards for each client they work with.
Here are some recruiting dashboard examples.
1. Recruitment Overview Dashboard
A recruitment overview dashboard is the one senior leaders will have open in a tab all day every day. It’s the one you’ll share with the agency’s CEO. Its role is to give an overview of the agency’s KPIs at a glance.
This ensures data transparency at a senior level as well as the quick identification and rectification of any issues.
It is important to note that every recruitment overview dashboard will look different, depending on your agency’s goals and KPIs.
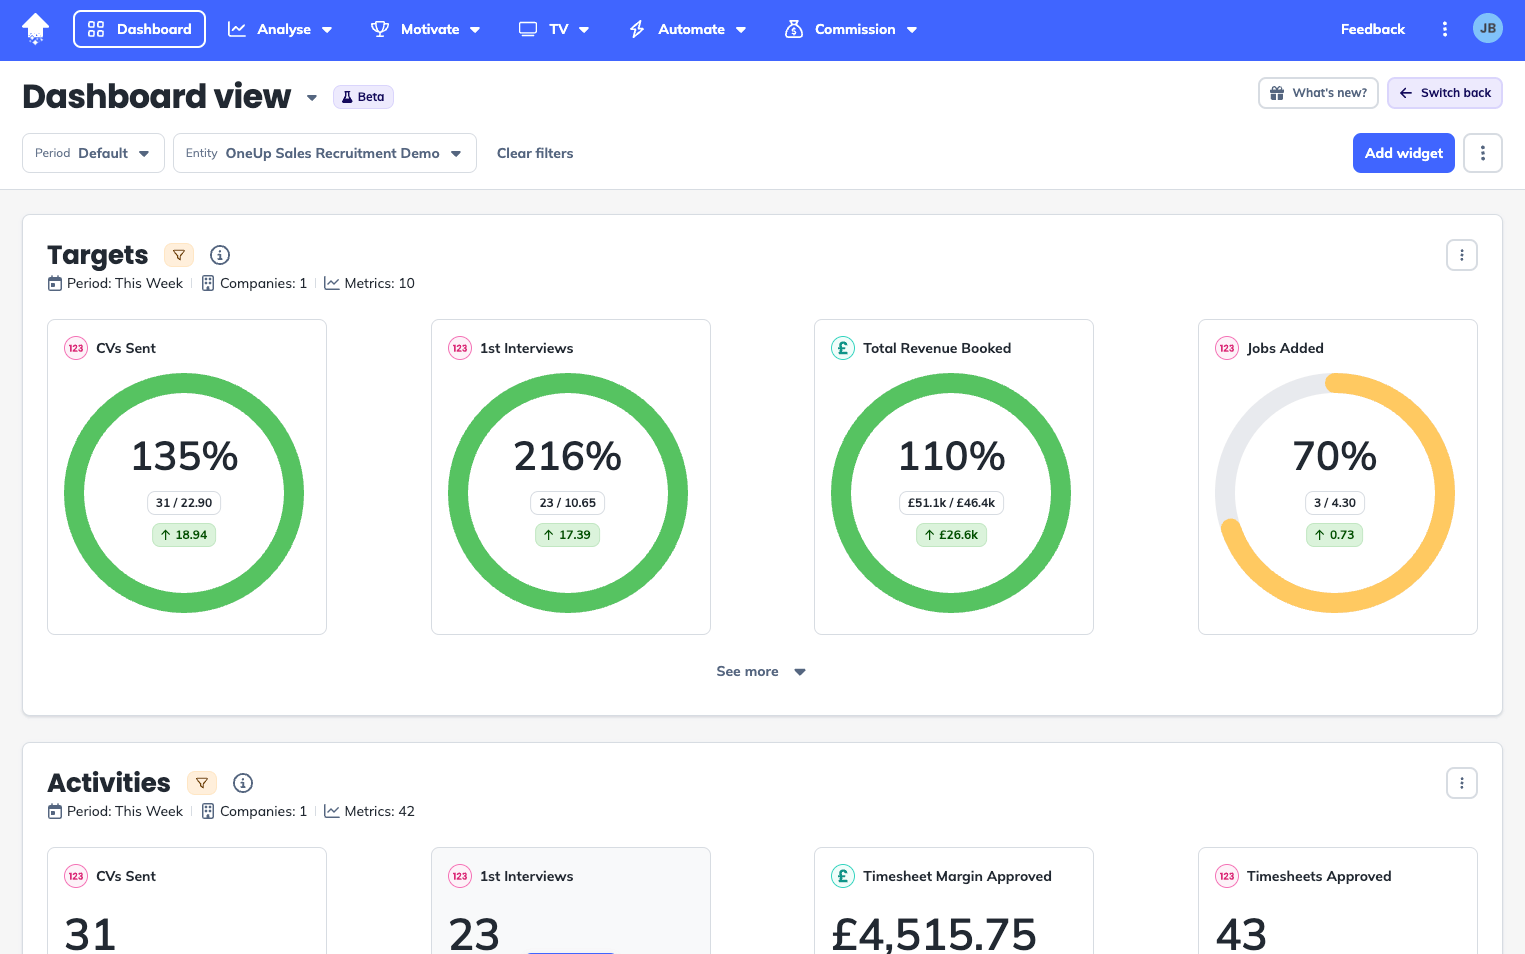
[Source: OneUp]
The recruitment dashboard sample above highlights is taken from OneUp. This is a Company-level dashboard that has the important numbers very clearly in graphical dials at the top of the page, so a busy CEO can check their progress towards targets at a glance.
Colour-codes make it easy to see if the agency is on track, ahead, or behind targets such as Revenue and Jobs Added.
2. Recruitment Funnel Dashboard
A recruitment funnel dashboard is incredibly useful for gaining an overview of the whole hiring process, including where it is breaking down, as well as an insight into the candidate experience.
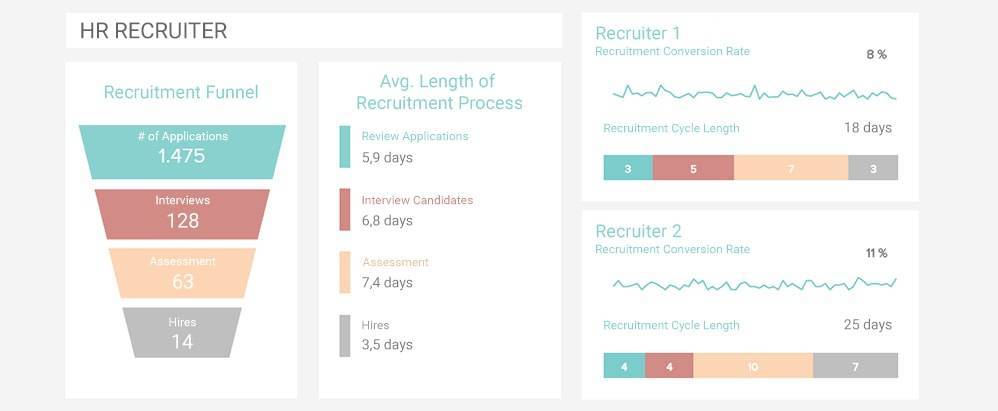
[Source: Datapine]
The dashboard for hiring above is designed to highlight any flaws within the recruitment process — and to track and compare the performance of two recruiters within that context.
It’s worth taking a look at a recruitment KPI dashboard template before developing yours, as there are a variety of different set-ups.
The visualisation on the left tracks the number of individuals currently within each stage of the funnel, while the middle column looks at the number of days they spend at each stage before being moved onto the next one or eliminated from the process.
Meanwhile, the two boxes on the right compare the performance of two recruiters in terms of conversion rate, and talent acquisition cycle length.
Many smart visualisation techniques are at play here. First up, the colour coding of each segment of the recruitment funnel makes it easy to quickly internalise the meaning of each chart.
The funnel-shaped visualisation on the left helps the user to understand the shape of the candidate experience, while the colour-coded lines in the ‘recruiter boxes’ allow you to see at a glance where within the funnel each recruiter is struggling to move their qualified candidates forward.
For example, you may determine from the HR recruitment dashboard above that while recruiter two is outperforming their colleague, they could improve by speeding up their assessment phase.
You can then investigate what actions they’re taking within the assessment phase and what’s causing the delay, and fix the issue.
3. Sourcing Dashboard
A sourcing dashboard determines the success of your candidate attraction activities. It gives an insight into which job boards, websites, and social media sites are working for you when it comes to sourcing applicants, both in terms of volume of applications and candidate quality.
This tells you which sourcing platforms you should be spending time and budget on, and which are simply a waste of resources when it comes to this part of the recruitment process.
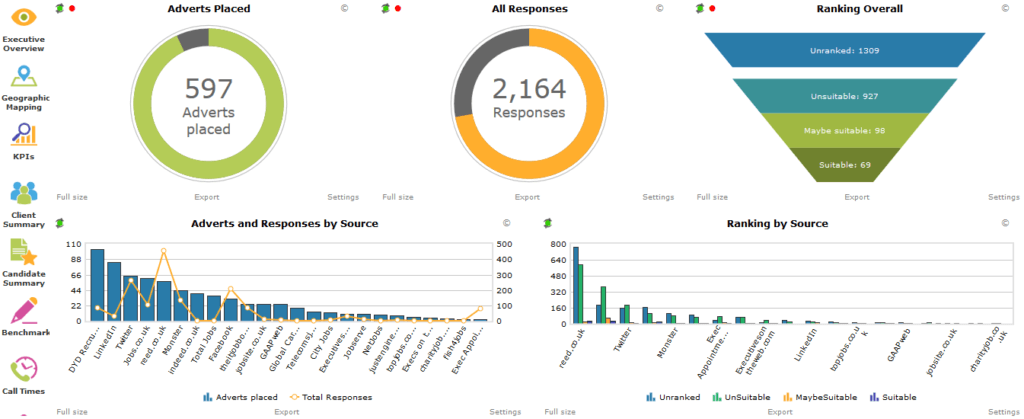
[Source: Recruiting Daily]
The sourcing dashboard above is clearly split into overall volume of applicants and candidate quality.
The circular charts provide a clear illustration of how many adverts have been placed against your target, and how many responses have been received, against your target — giving you a clear idea of how many more adverts you need to create in order to hit your response target.
The bar chart underneath shows which adverts have attracted the most responses vs the adverts placed, with the blue bars representing adverts placed and the orange line representing responses.
Meanwhile, on the right-hand side of the dashboard you find an inverted pyramid which breaks responses down into ‘unranked’, ‘unsuitable’, ‘maybe suitable’, and ‘suitable’.
This gives you a handy oversight into the quality of candidates your adverts are bringing in. Underneath, another bar chart breaks down this quality ranking by source. This is colour-coded in alignment with the funnel above, making it easily interpretable.
If you lean heavily on one sourcing channel, you may want to set up a separate but linked dashboard — such as a LinkedIn recruiter dashboard — for a more in-depth look at its performance.
4. Individual Recruiter Performance Dashboard
Keeping track of how recruiters are performing is a day-to-day task for agency leaders. And a recruitment KPI dashboard will make it so much easier.
Individual recruiter performance dashboards are crucial to strong people management. They allow managers to fix problems before they snowball, motivate team members, and upskill and develop recruiters.
Each recruiter should be targeted on key performance indicators in line with your overarching recruitment strategy. Different team members may also be targeted on different key performance indicators based on their personal development plans.
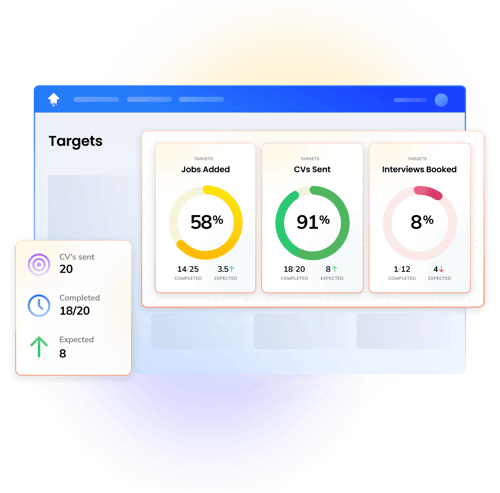
[Source: OneUp]
In the recruiting metrics dashboard template above, the recruiter or team has been targeted on three metrics: Jobs Added, CVs Sent, and Interviews Booked.
This example from OneUp is similar to the Recruitment Overview dashboard, however it is customised to an individual recruiter. Metrics are relevant only to them, as the are the targets and data being pulled in.
The circular chart relating to each metric in the sample recruitment dashboard provides a clear, colourful visualisation of just how close the recruiter is to hitting their goal. This figure is given in both percentage and numerical form to avoid any confusion.
Meanwhile, the ‘expected’ section provides a handy reminder of whether they are on track to hit their goal, with a green or red arrow to illustrate.
Recruitment Team Performance Dashboard
In addition to your individual recruiter performance dashboards, it’s important to create a transparent team performance dashboard. This empowers leaders to compare team members, foster healthy competition and collaboration, and ensure every recruiter is pulling their weight in progressing towards team-wide targets.
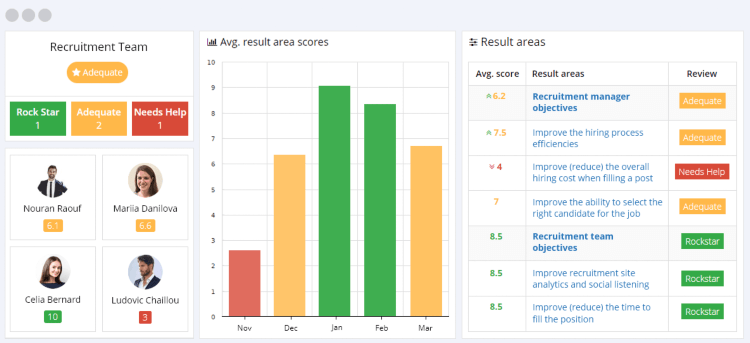
[Source: AssessTEAM]
The dashboard above employs a useful traffic light colour scheme to clearly demonstrate which areas are performing well, which are okay, and which need their attention.
It applies this colour scheme both to individual recruiters and to specific goals, and then generates an overall score for the team as a whole which in this case is ‘adequate’.
Helpfully, it also works on a grading system, giving recruiters and goals scores out of ten so managers can quickly and easily understand the scale of the success, or the issue.
Step-by-Step Guide on Creating Recruitment Dashboards
Now you know you need to set up recruiting dashboards, how do you start?
1. Define Your Recruitment Metrics
Consider your recruitment strategy.
Which recruitment metrics will tell you how well your team is performing or whether they’re on track to hit goals?
These may be classic recruitment metrics such as ‘CVs sent’, placements filled’, or ‘time to fill’. They may also encompass financial commission-based key performance indicators, or productivity metrics like ‘emails sent’ or ‘phone calls made’.
It’s worth consulting your recruiters and leadership team on the sort of metrics they would find most useful.
2. Consider Which Dashboards You Need
Now it’s time to arrange those metrics into useful, easy-to-understand dashboards.
Consider which dashboards you need to create, and who will have access to each one. Think about how much you want to segment the hiring process; as well as an overall recruitment dashboard, will you need to create one for a deeper look at sourcing or interviews, for example?
3. Choose Your Recruitment Dashboard Software
Now you understand what you need out of your dashboards, it’s time to choose the software that will best empower you to capitalise on your data.
When choosing your tool, consider:
- The look and feel of the dashboards
- How user-friendly the interface is
- How many custom dashboards it supports
- How effectively it will track your specific metrics
- Whether the integrations match your current tech stack
A leading recruitment analysis software, OneUp is extremely user-friendly — perfect for teams who do not have a background in data science. It also boasts a wide range of integrations, including recruitment CRMs, VoIP, enablement, timesheets, and even social media.
OneUp acts as a single source of truth for your data, and includes custom dashboards complete with beautiful visualisations that are easy to interpret at a glance.
4. Clean and Organise Your Existing Data
Your dashboards are only as strong as your data.
Before integrating analytics into your existing data structure, you need to ensure your data is clean and organised.
This means eliminating or fixing any data within your systems that is:
- Inaccurate
- Incomplete
- Inconsistent
Make sure the remaining data is organised in a logical manner and easy to navigate, and that it all exists on systems you plan to continue using going forward.
Best Practices For Organising Data Include:
- Creating reliable naming conventions
- Sticking to a short file name
- Creating an index to record and standardise data categories
- Ensuring you only retain the newest version of each file
It’s also crucial to practise robust data governance that involves compliance, and to train your recruiters in how to handle data and ensure accuracy.
5. Set Up Your Dashboards
Using your new data software, set up your dashboards.
The technical side of doing this will vary from tool to tool.
But remember:
- Be intentional. Think about the purpose of each dashboard, and ensure every specific metric included on the dashboard feeds into its goal. Don’t just stick every metric going on every single dashboard or it will become overly complex and difficult to interpret.
- Be mindful of the users. Consider who is going to have access to each dashboard. What do they need to see? What are their pain points relating to data and how can you overcome them with your dashboard design to engage them with data?
- Be visual. Use colour-coded charts and graphs to illustrate your data and segment the hiring process, thinking carefully about how best to present each metric. For example, recruitment funnels are commonly presented as an inverted pyramid because this helps the user visualise the flow of action, while progress towards targets can be displayed in a circular chart to help illustrate the percentage of work completed.
You can also gain inspiration from an existing HR recruitment dashboard template or a recruitment dashboard Excel template — there are plenty of examples available online.
6. Share Your Dashboards and Provide Training
Now your hiring metrics dashboard is up and running, it's time to put them in the hands of your recruiters and watch them flourish.
But first, you need to get their buy-in.
Explain how recruiting dashboards can tangibly boost their own performance within the hiring process, and why you’ve selected specific metrics.
Train them on how to use their dashboards — not only in a technical sense, but how to take actionable insights away too.
Achieve further buy-in by displaying team performance dashboards on screens in the office, and using them as your yardstick for recruiter performance.
And finally — follow up. Make space for data-related questions in one-to-ones with recruiters and investigate how they are using the new dashboards to boost their performance.
Dashboard Interactions and Stakeholder Relevance
Different stakeholders will interact with dashboards in different ways.
Their use of a custom recruitment dashboard can vary depending on some factors, including how busy stakeholders are, their priorities, their level of investment in the project, and their specific role within it.
Below we outline how different stakeholders interact with dashboards, which dashboard elements are most valuable to each group, and strategies for tailoring dashboards to meet the needs and priorities of various users.
Recruiters
Recruiters should be using their dashboard multiple times per day to check their progress and gather data to inform decisions.
On their recruitment tracker dashboard, individual recruiters require an overview of their performance as well as the capabilities to then dig deeper into specific metrics. Recruiters’ personal goals should be displayed on their dashboard, alongside a progress tracker.
Day-to-day operational elements like the number of CVs sent and interviews booked are vital here. A graphical real time version of the recruitment funnel is a common and useful addition to any recruiter dashboard. In addition, enable recruiter dashboards to segment metrics by client or hiring managers for more targeted troubleshooting.
Recruiters should also have access to a team dashboard, which contains performance information. This allows them to compare their progress against that of others on their team, fostering healthy competition.
Recruitment Agency Team Leaders
Recruitment agency managers will likely be the most frequent users of analytics dashboards. Their focus is on hitting team targets and ensuring their reps are achieving high levels of productivity.
Their dashboards should empower them to quickly zoom in and out of the data.
For example, they should easily be able to view their team’s overall recruitment funnel. But, noticing something amiss in the ‘applications’ section, they should be able to delve deeper into the relevant metrics — narrowing the issue down to client or recruiter — to fix the issue.
Using colour coding to highlight different team members on team leaders’ dashboards is a simple but effective way to make it easier for them to digest information.
Recruitment Agency Senior Leaders
Senior leaders at recruitment agencies — such as the CEO, MD, or COO — are likely to be very time-poor, but still need to keep their finger on the pulse. This is where custom dashboards come in.
These users are not going to be particularly interested in granular data. They will be more concerned about overall business performance and health. Ensure their dashboards highlight your agency’s landmark KPIs in an instantly understandable way. Use clear graphs and charts so they can take away insights at a glance.
Senior leaders are also understandably interested in the financial side of recruitment efforts. This means you’ll need to include more metrics surrounding commission, resource, and ROI on their dashboards compared to those of recruiters.
Benefits of Automated Recruitment Dashboards
Automated recruitment dashboards are highly beneficial compared to older manual models.
First and foremost, by automating repetitive, manual tasks, they provide a huge time-saving. There’s no longer any need to manually enter every data point, or spend hours painstakingly arranging raw data into charts and graphs.
This means much more time can be spent on valuable human-led tasks and business priorities such as communication or recruitment strategy. And that makes a huge difference.
Indeed, this time saving alone helps to boost overall performance.
And let’s not forget that most recruiters don’t enjoy tedious data entry tasks; your team will thank you for empowering them to spend time doing the parts of the job they like.
Vitally, automated dashboards also display real-time data.
Whether you’re running one-to-ones with your talent acquisition team, or reporting to the board, there’s little point working with out-of-date information. Old data puts you on the back foot — you may be highlighting problems that have already been resolved, or spotting trends you should have known about a month ago!
With real-time data, you’re equipped with up-to-the-minute data that empowers you to tackle problems as they arise and spot trends before they snowball.
Case study 1: Eligo Recruitment
Eligo Recruitment is a specialist recruitment partner in the UK, US, and Europe. It recruits across the technology, Open Source, ERP and SAP, Fire & Security, Medical, and Events sectors.
Eligo turned to OneUp’s automated dashboards due to a lack of data visibility in its CRM.
The organisation was struggling to review activity and revenue quickly and easily ahead of weekly manager meetings and monthly board meetings.
This meant decisions were being made on opinions rather than data, meetings were lengthy and not as productive, and the company struggled to use data to identify what was working and where risks were.
Now, Eligo capitalises on the benefits of OneUp dashboards and real-time Matrix reports. This empowers the business’ leaders to make data-driven decisions, enabling automation, better decisions, and increased productivity across the business.
Furthermore, the organisation also boosted its data quality through OneUP’s League and Missions features, which it used to gamify the logging of data. With data quality significantly improved, Eligo was then able to automate other processes such as commissions calculations.
The results?
- More insightful and productive meetings
- Data quality has greatly improved
- A 600% increase in client introductions
Case study 2: PSR Solutions
PSR Solutions is an industry-leading construction recruitment agency with seven UK offices and 110 reps.
But after switching CRMs, PSR found itself with markedly reduced data visibility and difficulties with reporting.
Staff and leaders were therefore unable to make data-driven decisions and activity and revenue were dropping due to a loss of accountability.
Furthermore, the previously competitive and fun atmosphere disappeared, risking staff churn.
Using OneUp’s automated dashboards, the organisation was able to increase data visibility and reporting.
PSR’s team was now able to create the custom reports they needed, automate delivery to the senior leadership team, and provide improved visibility of data at the desk level. This increased access to data meant the team was able to understand their performance metrics better and make data-driven decisions.
PSR also employed OneUp’s motivational features to increase rep productivity.
This led to:
- A 33% increase in jobs added
- A 28% increase in CVs sent
- A 58% increase in total placements
Incorporating Recruitment Dashboards Into Daily Operations
Getting your dashboards up and running is just the first step. For truly data-driven operations, you and your team then need to incorporate them into daily operations.
Even with the best of intentions, this can be a difficult habit to form.
Make Sure You Follow This Best Practice Guidance:
- Make dashboards a part of daily workflows. This might mean recruiters need to report on their key KPIs at a daily morning standup or check on ‘CVs Sent’ at the end of every day as part of a personal development goal. Either way, build checking dashboards into daily workflows and then hold your team accountable.
- Prominently display dashboards around the office. With OneUp, team leaders can display their team dashboards and leaderboards on screens around the office. Not only does this engender healthy competition within the team, but it keeps dashboards front-of-mind and will encourage recruiters to check their dashboards to find out how they can improve their performance.
- Automate reports. If you’re worried dashboards will slip down the priority list, make sure your team can’t forget about them by automating reports that land directly in their inbox every day.
- Ask to see recruiters’ working. When a recruiter makes a decision, ask why. Is their decision data-driven? Can they show you the supporting evidence as to why that’s the best approach? Make sure that every decision is backed by strong data.
- Lead by example. If you clearly and prominently prioritise data, it’s only a matter of time before your team follows in your footsteps. Explain why you’re making certain decisions, celebrate great results that follow data-driven decisions, and frequently bring dashboards into a team and individual meetings.
Not only will these steps incorporate dashboards into daily operations, but they will encourage a culture of data-driven decision-making within recruitment teams.
Future Trends in Recruitment Dashboards
Of course, technology continues to evolve apace.
In just a couple of years, you can expect your recruiting dashboard to look very different to how it does now.
In the coming years, we predict that recruitment agencies will demand more data and better access to that data.
This will mean recruitment dashboards will pull data from more sources — and therefore grow the number of integrations they offer — or draw a larger volume of data from current sources.
What’s more, those data sources themselves will need to collect more data in a wider range of categories.
Agencies will also want better access to that data. This will see recruiters increasingly upskilled in utilising dashboards, data analytics, and data-driven decision-making. The best recruiting dashboards will offer access to ever-larger numbers of employees to democratise this data.
These two trends will result in more targeted data being available, empowering recruiters to drive efficiencies in their jobs pipelines.
Does this mean more work for recruiters and agency team leaders?
Not necessarily.
It’s no secret that AI technology is snowballing. We can expect to see increasingly sophisticated AI tools shouldering even more of the data workload. Furthermore, as AI advances it will be able to create ever-more complex and in-depth visualisations based on wider data sets.
Future-proof Your Dashboards By:
- Ensuring all recruiters have access to relevant dashboards
- Training all recruiters in using dashboards to draw data insights and make data-driven decisions
- Adopting time-saving AI tools, and staying abreast of innovations coming to market
- Considering what data you don’t currently collect or have access to could be useful in the future
Final Thoughts
To recap, effective recruitment dashboards are:
- Tailored to their users’ goals
- Easy to understand; they don’t cover too many metrics at once
- Based on accurate, consistent, and complete data
- Highly visual to allow intuitive interpretation of data
- Boosted by time-saving AI tools
- Easily accessible by all relevant stakeholders
- Incorporated into daily workflow
- The first port of call before data-driven decisions are made
As recruiters’ decisions become increasingly data-driven, agencies can’t afford to ignore the myriad benefits of a robust infrastructure of dashboards.
With competitors increasingly capitalising on recruitment dashboards, failing to jump on board may see your recruiters left behind.
But for an optimised dashboard recruiting process, simply follow the steps and best practices outlined above.
Leading recruitment analytics software OneUp makes it easy to effectively create and manage all your recruitment dashboards. See how it works and book your demo here.